Green (Indicator): Difference between revisions
| Line 10: | Line 10: | ||
This Excel indicator can be downloaded from the [https://store.tygron.com/ Tygron Index]. Read on to find out more about the indicator's calculation method and how to set it up in your project. | This Excel indicator can be downloaded from the [https://store.tygron.com/ Tygron Index]. Read on to find out more about the indicator's calculation method and how to set it up in your project. | ||
''Note: this indicator is the same as the default Green indicator from the Indicator menu in the {{software}}.'' | |||
===Indicator panel=== | ===Indicator panel=== | ||
Revision as of 09:42, 28 August 2019
General
What is the Green indicator?
The green indicator calculates the amount of nature and green constructions in a neighborhood. The indicator then relates this to the amount of houses in the area. A target can be set for the amount of green per house. This indicator is useful for projects where for example:
- livability is an important aspect in the project
- the project area should become climate adaptive
- compensation in the form of green is required for new housing projects
This Excel indicator can be downloaded from the Tygron Index. Read on to find out more about the indicator's calculation method and how to set it up in your project.
Note: this indicator is the same as the default Green indicator from the Indicator menu in the Tygron Platform.
Indicator panel
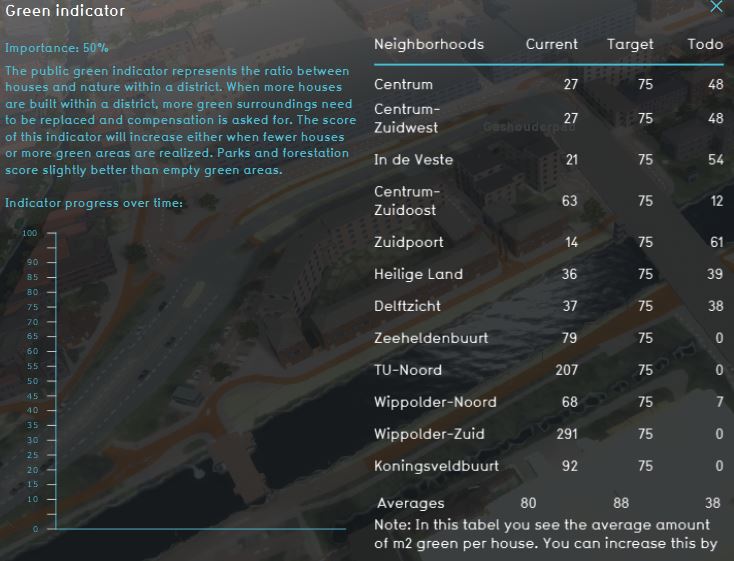
The indicator panel shows per neighborhood:
- the neighborhood name
- the current amount of green (m2) in the neighborhooud
- the target amount of green (m2) for the neighborhood
- how much green in (m2) per neighborhood should be build
Calculation
The green indicator calculates the amount of houses and the amount of open green space and green functions. Open green space means:
Green functions are functions such as houses with a green roof or a city park for example. These functions all have a value for the GREEN_M2 function value. The amount of open green space and green functions added together is the amount of green.
The indicator scores based on how much green in m² exists per house and relates this to the set target. According to [1], there is no norm for the amount of green per house, but 75 m2 can be used as a guideline.
The more green in the project, the better. A project with less houses will require less green than a project with lots of houses.
Score
The score is represented in a progress bar, with a scale from 0 to 100%. Determine if you want to calculate the absolute or relative score.
Additional configurations
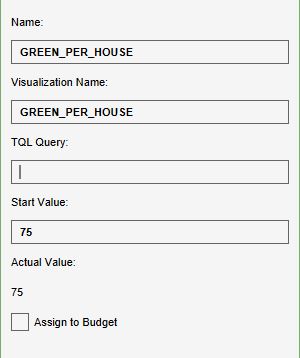
For this indicator to function, a global to set the target has to be defined. Read below for the steps.
Add the Global
The target for the amount of green in m2 per house is set in a global. To learn more about what a global is, please go to the Globals page.
- Select Current Situation and then hover over TQL Queries in the ribbon header
- Click on Add Global in the hover panel. A new global named VARIABLE will be added to the left panel.
- Select the global VARIABLE.
- In the right panel, change the name to GREEN_PER_HOUSE
- Change the start value to a number representing the amount of green in m2 per house
- Hover over the Auto update icon and choose for Reset to Start values (faster) to update your project.
References
- ↑ (2010). Beschikbaarheid groen in de stad, 2000 - 2006. https://www.clo.nl/indicatoren/nl029906-beschikbaarheid-van-groen-in-de-stad

