Benchmark Wageningen analysis: Difference between revisions
No edit summary |
No edit summary |
||
| Line 1: | Line 1: | ||
The Wageningen | The Wageningen and Tygron-generated PET overlays are shown below: | ||
<ul> | <ul> | ||
| Line 27: | Line 27: | ||
===Foliage input generation=== | ===Foliage input generation=== | ||
The Wageningen PET Test Case contains a tree height polygon data source. Per polygon, the maximum height is stored and the polygon itself represents the crown of the tree. This results in generally too much foliage height, since the decline of the trees towards the edges of the crown is not taken into account. | The Wageningen PET Test Case contains a tree height polygon data source. Per polygon, the maximum height is stored and the polygon itself represents the crown of the tree. This results in generally too much foliage height, since the decline of the trees towards the edges of the crown is not taken into account. Higher foliage height generally causes excessive shade and overestimates wind reduction. | ||
To address this, we created an approximate foliage height [[GeoTIFF]] by rasterizing the tree height polygons and subtracting the surface and terrain heights. | |||
<ul> | <ul> | ||
<li style="display:inline-block">[[File:foliage_heights_wageningen.png|x300px|thumb|left|Overview of the foliage height in Wageningen]]</li> | <li style="display:inline-block">[[File:foliage_heights_wageningen.png|x300px|thumb|left|Overview of the foliage height in Wageningen]]</li> | ||
| Line 38: | Line 37: | ||
<br style="clear:both;"> | <br style="clear:both;"> | ||
However, this GeoTIFF may introduce excessive height variations among trees, overestimating the [[Wind calculation model (Heat Stress Overlay)|frontal foliage surface]]. | |||
More research has to be done to find out what effect this variation of foliage height has on wind reduction. | More research has to be done to find out what effect this variation of foliage height has on wind reduction. | ||
Latest revision as of 13:42, 8 July 2026
The Wageningen and Tygron-generated PET overlays are shown below:
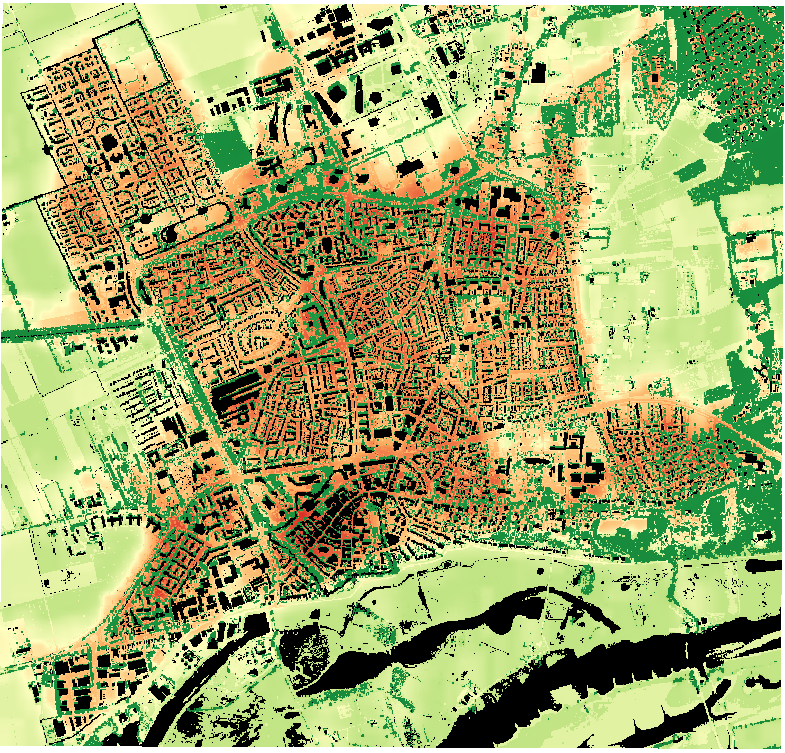
PET daytime map for August 2, 2013 12 UTC with the meteorology of the reference station Herwijnen from the DPRA Heat stress report 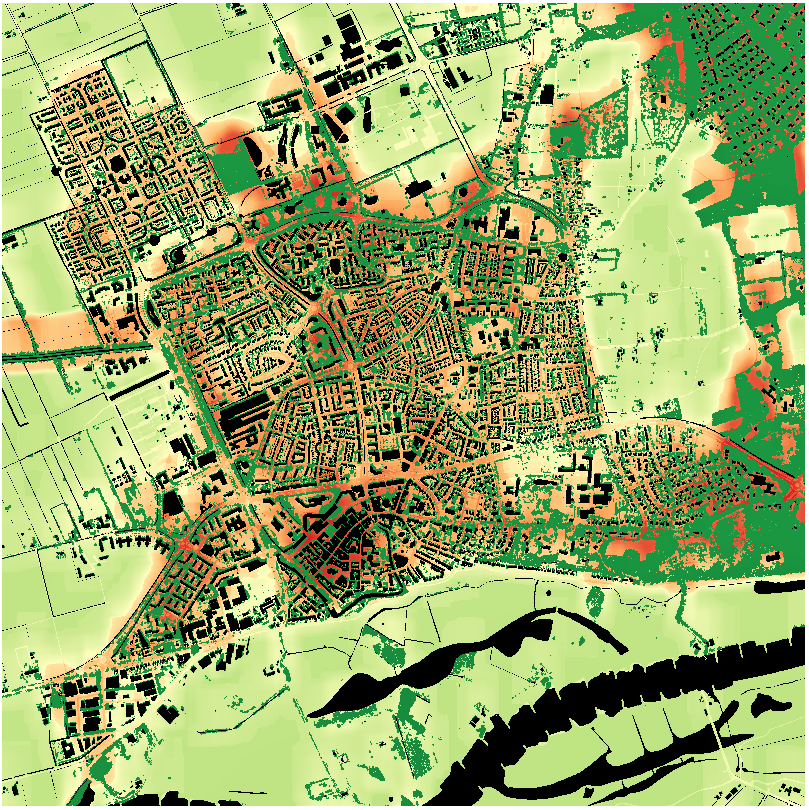
PET daytime map for August 2, 2013 12 UTC with the weather data from the reference station Herwijnen as calculated by the Tygron Platform 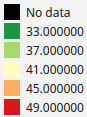


A few differences in the PET results can be explained by differences in input data:
- Foliage height source.
- Wind calculation for areas with a lot of foliage.
- The spatial variation of vegetation, especially in gardens.
- Slight differences in geometry data versions (buildings, parking lots, and water present/not present).
Foliage and the effect on wind
The calculated wind speed differs in areas with a large number of trees, as you can see in the images below (Tygron wind map is on the right):
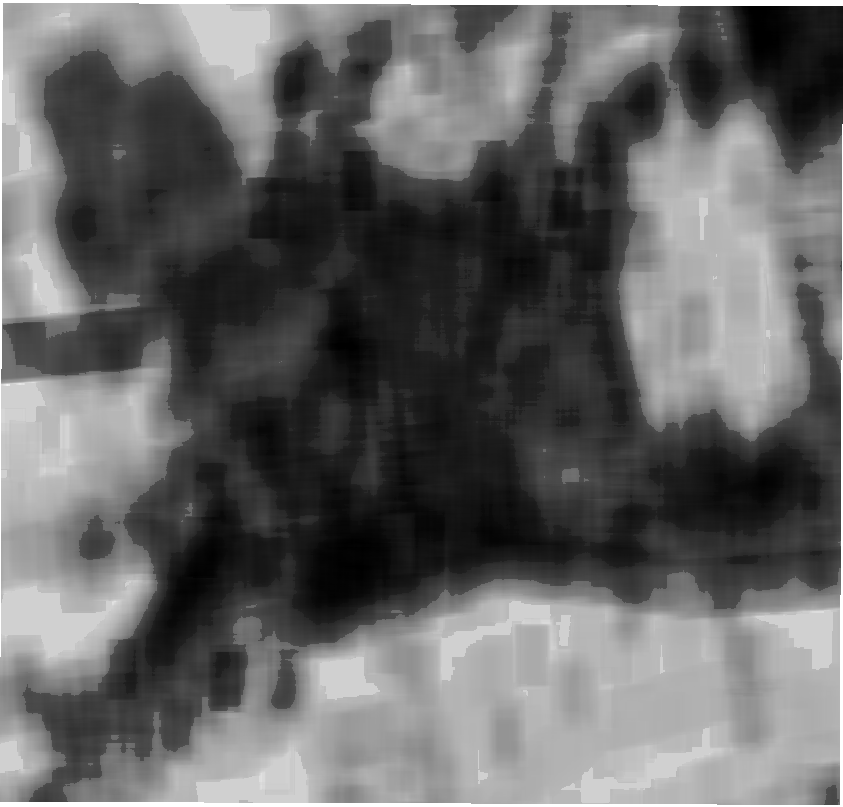
Wind speed August 2, 2013 12 UTC 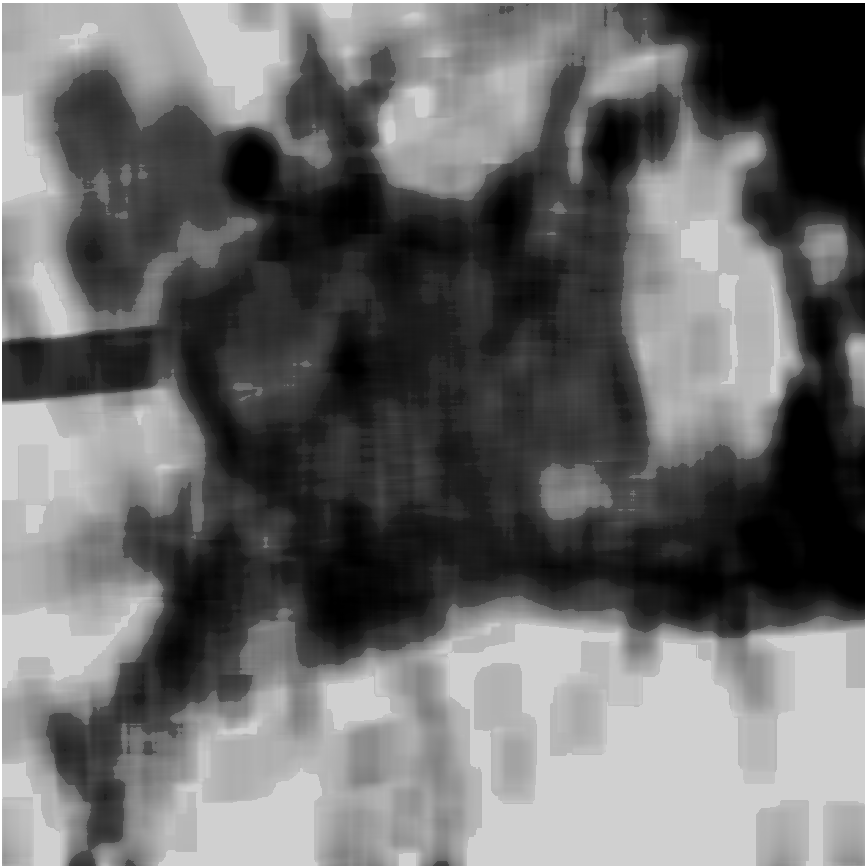
Wind speed August 2, 2013 12 UTC as calculated by the Tygron Platform 


The foliage input data might be a cause for these differences. See the next section for a possible explanation and possible improvements.
Foliage input generation
The Wageningen PET Test Case contains a tree height polygon data source. Per polygon, the maximum height is stored and the polygon itself represents the crown of the tree. This results in generally too much foliage height, since the decline of the trees towards the edges of the crown is not taken into account. Higher foliage height generally causes excessive shade and overestimates wind reduction.
To address this, we created an approximate foliage height GeoTIFF by rasterizing the tree height polygons and subtracting the surface and terrain heights.
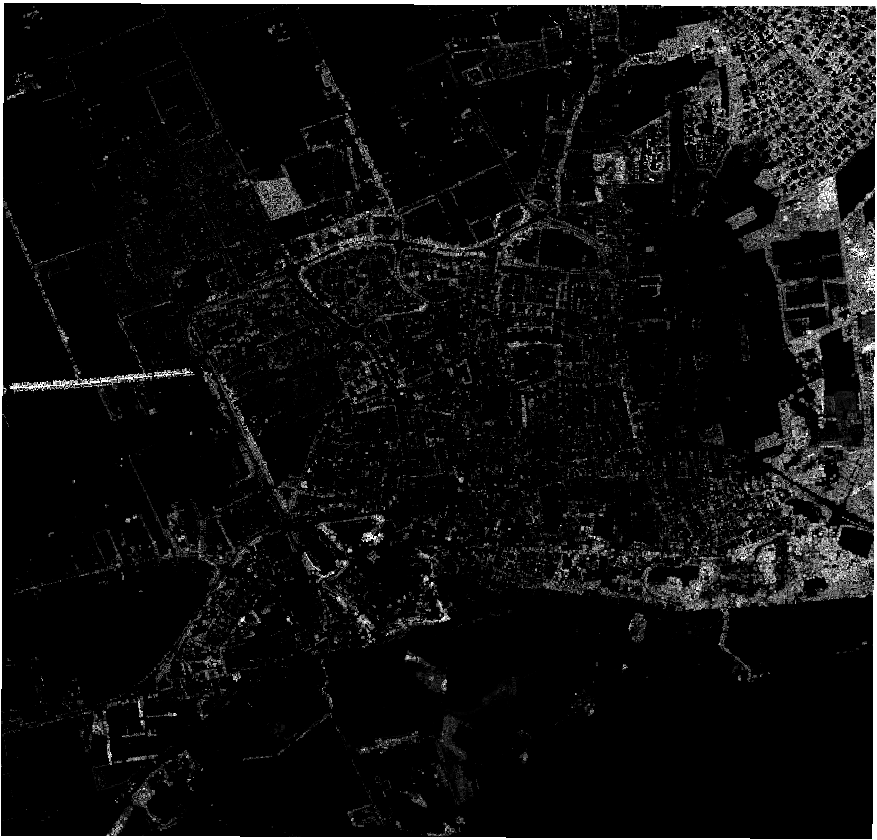
Overview of the foliage height in Wageningen 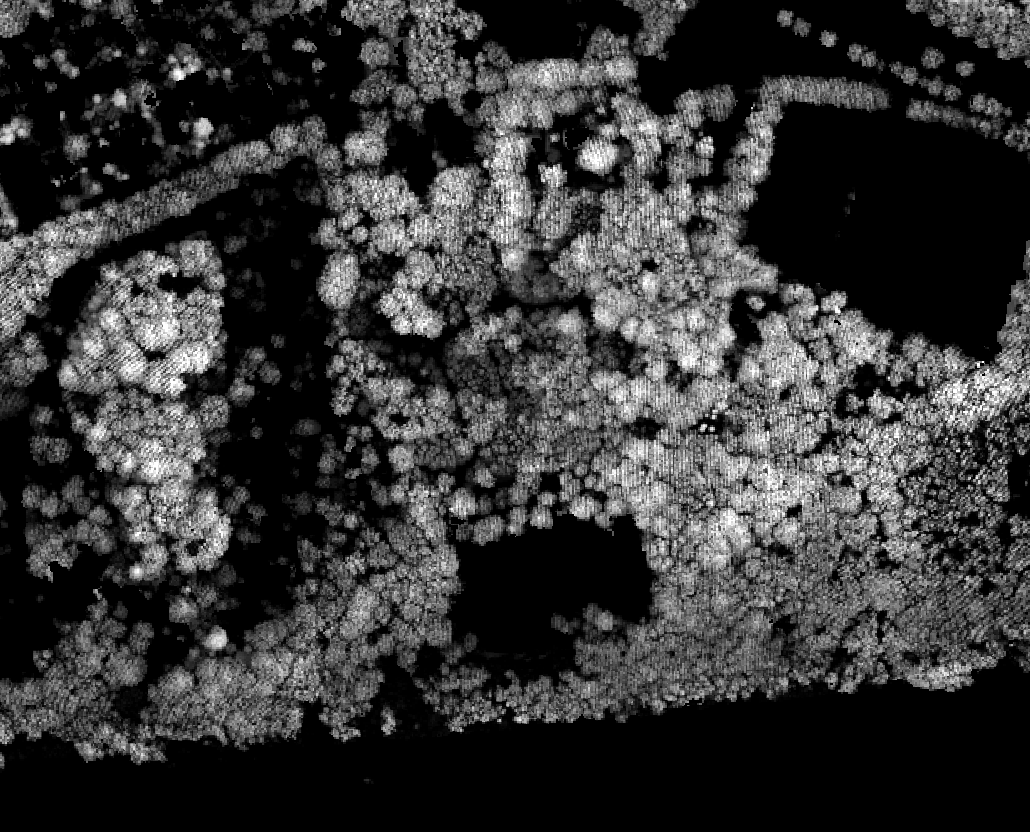
Zoomed in on the foliage height in Wageningen, east-south-east corner of the overview 


However, this GeoTIFF may introduce excessive height variations among trees, overestimating the frontal foliage surface.
More research has to be done to find out what effect this variation of foliage height has on wind reduction.
Vegetation fraction spatial variation
The vegetation fraction in the PET Wageningen result has been calculated using the RGB and Infra-red imagery data. In the Tygron engine the vegetation fraction is determined by the buildings , their function and terrains in case no buildings are present.
See also



- Group
- Model attributes
- Daily average radiation • Daily average wind speed • Daily maximum temperature • Daily minimum temperature • Dates • Exclude buildings • Exclude water • Exclude foliage height m • Foliage areas • Hourly humidity • Hourly radiation • Hourly temperature • Max shadow distance • Sun altitude • Sun azimuth • Sun daily motion • Wind direction • Wind speed • Wind decline angle
- Group
- Building attributes
- Bowen ratio • Foliage height • Foliage crown factor • Vegetation fraction
- Terrain attributes
- Bowen ratio • Vegetation fraction
- Area attributes
- Foliage height
- Group
- Prequels
- Building elevation • Foliage height • Terrain elevation
- Related