Green MKP (Indicator): Difference between revisions
(Created page with "{{learned|what the green MKP indicator is|how the green MKP indicator is used|how to tweak the green MKP indicator}} ==General== The protest indicator is a tool for stakehold...") |
No edit summary |
||
| (37 intermediate revisions by 6 users not shown) | |||
| Line 1: | Line 1: | ||
The green MKP Indicator calculates per different type of area a grade based on the amount of green in this area. The allocation of the area determines the calculation of the grade. Each type of area has different parameters for the amount and value of green. For example, an area with mostly industrial buildings is allowed to have less green than a residential area. | |||
This indicator is for example useful for projects in where: | |||
*(one of the) goals is to work on reaching a certain green target | |||
*different spatial plans are compared using the [[3D Visualization]] | |||
*the project area should become climate adaptive | |||
The green MKP Indicator belongs to the set of MKP indicators. MKP stands for Environmental Quality Models (MileuKwaliteitsProfielen) and consist of up to 20 indicators to assess the built environment. The MKP and therefore the indicators are created by the Province of Utrecht. Read more about the MKP indicators and the theory behind it on [[MKP_(Indicators)|this page]]. | |||
This Excel indicator can be downloaded from the Public [[GeoShare]]. Read on to find out more about the indicator's calculation method and how to set it up in your project. | |||
===Indicator panel=== | ===Indicator panel=== | ||
[[File: | [[File:Area_MKP_green_indicator.jpg|thumb|The MKP Green indicator.|300px|right]] | ||
The indicator panel shows the following information: | The indicator panel shows the following information: | ||
* | * The area name | ||
* | * The score per area | ||
{{clear}} | {{clear}} | ||
===Calculation=== | ===Calculation=== | ||
The indicator | The indicator calculates the amount of m2 green per area. This is backchecked against the allocation plan per area to calculate the score per area.The following formula is used: | ||
<br>[[File:Calculatie_MKP_green.jpg|400px|The calculation MKP Green indicator.]] | |||
[[File:Calcualtie_score_MKP_green.jpg|The calculation of score MKP Green indicator.]] | |||
===Score=== | ===Score=== | ||
The | The score is represented in a progress bar, with a scale from 0 to 100%. Determine if you want to calculate the [[Indicators#Absolute_score|absolute or relative score]]. In general, the more green is present in an area, the higher the score is. | ||
==Additional configurations== | |||
For this indicator, the area types your project consist of have to be imported or created in the project. For the steps and how to, read the information on the [[MKP_(Indicators)#Additional_configurations|general MKP page]]. | |||
{{Indicator nav}} | |||
[[Category:Public GeoShare]] | |||
Latest revision as of 16:05, 2 February 2023
The green MKP Indicator calculates per different type of area a grade based on the amount of green in this area. The allocation of the area determines the calculation of the grade. Each type of area has different parameters for the amount and value of green. For example, an area with mostly industrial buildings is allowed to have less green than a residential area.
This indicator is for example useful for projects in where:
- (one of the) goals is to work on reaching a certain green target
- different spatial plans are compared using the 3D Visualization
- the project area should become climate adaptive
The green MKP Indicator belongs to the set of MKP indicators. MKP stands for Environmental Quality Models (MileuKwaliteitsProfielen) and consist of up to 20 indicators to assess the built environment. The MKP and therefore the indicators are created by the Province of Utrecht. Read more about the MKP indicators and the theory behind it on this page.
This Excel indicator can be downloaded from the Public GeoShare. Read on to find out more about the indicator's calculation method and how to set it up in your project.
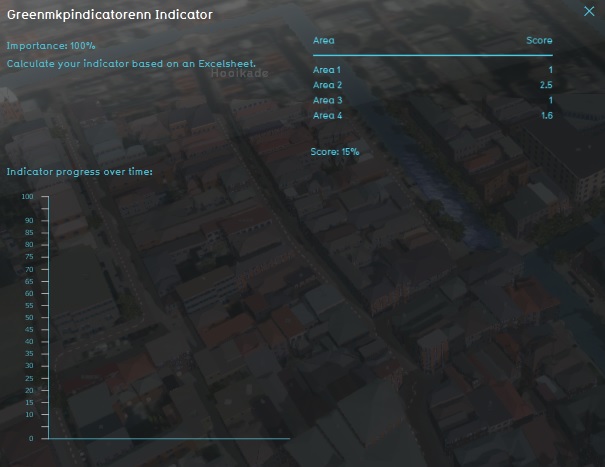
Indicator panel
The indicator panel shows the following information:
- The area name
- The score per area
Calculation
The indicator calculates the amount of m2 green per area. This is backchecked against the allocation plan per area to calculate the score per area.The following formula is used:


Score
The score is represented in a progress bar, with a scale from 0 to 100%. Determine if you want to calculate the absolute or relative score. In general, the more green is present in an area, the higher the score is.
Additional configurations
For this indicator, the area types your project consist of have to be imported or created in the project. For the steps and how to, read the information on the general MKP page.
