Heat risk (Indicator): Difference between revisions
No edit summary |
No edit summary |
||
| (51 intermediate revisions by 5 users not shown) | |||
| Line 1: | Line 1: | ||
The heat risk indicator calculates a metric for the risk to vulnerable citizens due to heat stress. It correlates information on residents of age 65 and older from the [[GEO_Data|CBS dataset]], the [[Heat_(Overlay)|Heat stress Overlay]] and the amount of recently built houses. In this indicator it is assumed that modern houses have better isolation and therefore retain more heat. | |||
This indicator is useful for projects in which (for example): | |||
* heat stress and the effect on citizens is measured | |||
* livability plays an important part | |||
This Excel indicator can be downloaded from the Public [[GeoShare]]. Read on to find out more about the indicator's calculation method and how to set it up in your project. | |||
=== | |||
The | ===Indicator panel=== | ||
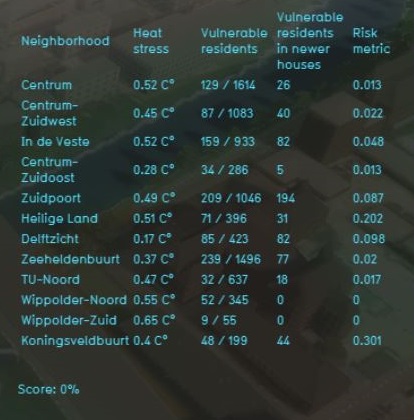
[[File:Heat_risk_panel.JPG|300px|right]] | |||
* heat | The indicator panel (see the image on the right) shows in a table per [[Neighborhoods|neighborhood]]: | ||
* the neighborhood name | |||
* the average heat stress | |||
* the amount of elderly people (65 years and older) and the total amount of people living in this neighborhood | |||
* the amount of elderly people that are living in modern housing | |||
* the risk assigned to this neighborhood. The higher the number, the higher the heat risk is. | |||
===Calculation=== | ===Calculation=== | ||
First the heat stress in an area is calculated. For more information about this calculation, read the following [[Heat_(Overlay)#Calculations|section]]. More heat stress is a greater risk. Then the amount of people of 65 years are counted for each neighborhood. If there are more elderly people living in a neighborhood, there is a greater risk. The amount of [[Units|houses]] after 2012 are counted as modern housing. The newer the houses are, the greater the risk. The risk is then calculated as: | |||
risk = Percentage elderly people x the heat stress in degrees. | |||
===Score=== | |||
The score is represented in a progress bar, with a scale from 0 to 100%. The score is | The score is represented in a progress bar, with a scale from 0 to 100%. Determine if you want to calculate the [[Indicators#Absolute_score|absolute or reative score]]. | ||
The higher the score, the less heat risk for the elderly there is. | |||
==Additional configurations== | ==Additional configurations== | ||
For this indicator to function, | For this indicator to function, only the [[Heat_(Overlay)|heat stress overlay]] has to be added to the project, see below for the steps. However, due to the reliance on [[GEO_Data|CBS data]] which is a Dutch dataset, the indicator will only function on projects located in the Netherlands. | ||
===Add the Heat stress overlay=== | |||
When the indicator is added to the project, an error message can be given. This is due to the missing [[Heat_(Overlay)|Heat stress overlay]] in the project. Read below on how to add this overlay to the project. | |||
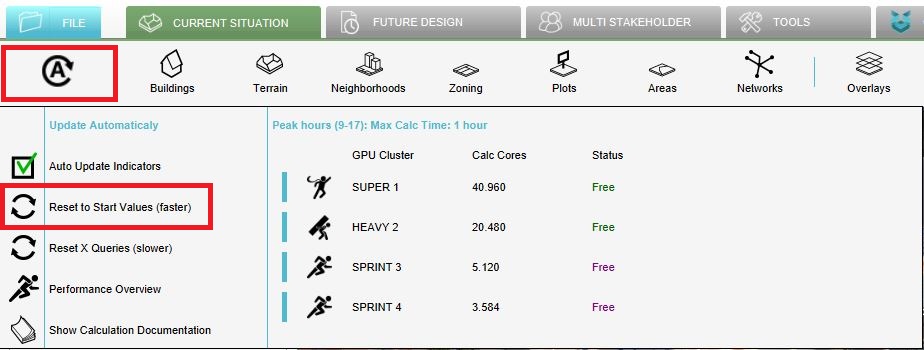
{{Editor steps|title=|Select in the editor ''Current situation'' from the ribbon|Hover over ''Overlays'' in the ribbon bar|Select the Heat stress overlay from the drop down menu|Hover over the Auto update icon and choose for Reset to Start values (faster) to update your project.}} | |||
<gallery heights=300px widths=300px mode=nolines> | |||
File:Add_overlays_new_interface.JPG | |||
File:Recalculate_excel.JPG | |||
</gallery> | |||
{{Indicator nav}} | |||
[[Category:Public GeoShare]] | |||
Latest revision as of 16:06, 2 February 2023
The heat risk indicator calculates a metric for the risk to vulnerable citizens due to heat stress. It correlates information on residents of age 65 and older from the CBS dataset, the Heat stress Overlay and the amount of recently built houses. In this indicator it is assumed that modern houses have better isolation and therefore retain more heat. This indicator is useful for projects in which (for example):
- heat stress and the effect on citizens is measured
- livability plays an important part
This Excel indicator can be downloaded from the Public GeoShare. Read on to find out more about the indicator's calculation method and how to set it up in your project.
Indicator panel
The indicator panel (see the image on the right) shows in a table per neighborhood:
- the neighborhood name
- the average heat stress
- the amount of elderly people (65 years and older) and the total amount of people living in this neighborhood
- the amount of elderly people that are living in modern housing
- the risk assigned to this neighborhood. The higher the number, the higher the heat risk is.
Calculation
First the heat stress in an area is calculated. For more information about this calculation, read the following section. More heat stress is a greater risk. Then the amount of people of 65 years are counted for each neighborhood. If there are more elderly people living in a neighborhood, there is a greater risk. The amount of houses after 2012 are counted as modern housing. The newer the houses are, the greater the risk. The risk is then calculated as: risk = Percentage elderly people x the heat stress in degrees.
Score
The score is represented in a progress bar, with a scale from 0 to 100%. Determine if you want to calculate the absolute or reative score. The higher the score, the less heat risk for the elderly there is.
Additional configurations
For this indicator to function, only the heat stress overlay has to be added to the project, see below for the steps. However, due to the reliance on CBS data which is a Dutch dataset, the indicator will only function on projects located in the Netherlands.
Add the Heat stress overlay
When the indicator is added to the project, an error message can be given. This is due to the missing Heat stress overlay in the project. Read below on how to add this overlay to the project.
- Select in the editor Current situation from the ribbon
- Hover over Overlays in the ribbon bar
- Select the Heat stress overlay from the drop down menu
- Hover over the Auto update icon and choose for Reset to Start values (faster) to update your project.


