Wind turbine (Indicator): Difference between revisions
(Created page with "{{learned|what the green MKP indicator is|how the green MKP indicator is calculated|how to adjust your project in order to make the indicator functional}} ==General== The gre...") |
No edit summary |
||
| (21 intermediate revisions by 6 users not shown) | |||
| Line 1: | Line 1: | ||
The Wind turbine indicator calculates the amount of wind turbines in the project area and the amount of generated power in MW. The amount is calculated by comparing the current situation and the planned situation. By setting a target value it is possible to experiment with scenarios for renewable energy in the project area. For example, the target for the generated power in the project area is 10 MW. This target then needs to be reached by planning both large and normal wind turbines in the project area. The target value and the amount of power per type of wind turbine is adjustable, which makes this indicator scalable for different types of projects. | |||
This indicator is for example useful for projects in where: | This indicator is for example useful for projects in where: | ||
(one of the) goals is to work on reaching a certain renewable energy target | |||
different spatial plans are compared using the [[3D Visualization]] | |||
the project area should become climate adaptive | |||
This Excel indicator can be downloaded from the Public [[GeoShare]]. Read on to find out more about the indicator's calculation method and how to set it up in your project. | |||
===Indicator panel=== | ===Indicator panel=== | ||
[[File: | [[File:Wind_turbine_indicator_panel.png|thumb|The wind turbine indicator.|300px|right]] | ||
The indicator panel shows the following information: | The indicator panel shows the following information: | ||
* The | * The amount of current turbines | ||
* The amount of current large turbines | |||
* The amount of planned turbines | |||
* The amount of planned large turbines | |||
* The total amount of generated power in MW | |||
* The score per area | * The score per area | ||
{{clear}} | {{clear}} | ||
===Calculation=== | ===Calculation=== | ||
The indicator calculates the amount of | The indicator calculates the amount of wind turbines in order to calculate how much MW is generated. The normal size turbine generates 1 MW and the large turbine generates 3 MW. The amount of MW generated per turbine is based on this source [[https://www.windcentrale.nl/blog/hoeveel-energie-levert-een-windmolen-op/| windcentrale]]. | ||
The following formula is used: | |||
(amount of turbines normal * 1MW) + (amount of turbines large * 3MW)= total amount of MW | |||
===Score=== | ===Score=== | ||
The score is represented in a progress bar, with a scale from 0 to 100% | The score is represented in a progress bar, with a scale from 0 to 100%. | ||
==Additional configurations== | ==Additional configurations== | ||
For this indicator, the | For this indicator, the Global POWER_TARGET needs to be added. | ||
Also the Attribute POWER needs to be added to the functions "Windmill" and "Windmill (Large)" in the function values table | |||
See below for the steps: | |||
===Add the global=== | |||
The target is set in a [[Global]]. To learn more about what a global is, please go to the [[Globals]] page. | |||
{{Editor steps|title=|Select the ''Current situation'' and then hover over the ''TQL Queries'' button in the ribbon header. |Click on the ''Add Global'' button in the hover panel. A new global named VARIABLE will be added to the left panel.| Select the global VARIABLE.| In the right panel, change the name to POWER_TARGET. | Change the start value to a number representing your total target.|Hover over the Auto update icon and choose for Reset to Start values (faster) to update your project.}} | |||
<gallery mode=nolines> | |||
File:Add_global_new_interface.JPG | |||
File:Recalculate_excel.JPG | |||
</gallery> | |||
===Add the attribute=== | |||
The generated power per type of wind turbine is set in the [[Functions#Function_values|function values table]]. To learn more about this table, please go to the [[Functions#Function_values|function values table]] page. | |||
{{Editor steps|title=|Select the ''Current tab'' and hover over the ''Buildings'' button in the ribbon header| Click on ''Edit function values'' in the hover menu.| Set the ''Category filter'' on ''Other''|Click in the left bottom corner on the Add button after Function| In the new panel, choose the Windmill function and click on Apply.| Repeat the steps 3 and 4 for the Windmill large function|Now write in the left bottom corner after Attributes, the new attribute name: POWER and click on Add. The new attribute POWER is created.|Search for the attribute POWER in the table and set the desired values for each type of windmill by clicking two times on the value and entering a new value.| Hover over the Auto update icon and choose for Reset to Start values (faster) to update your project.}} | |||
<gallery> | |||
File:Edit_function_values.JPG | |||
File:Category.JPG | |||
File:Add_function_table.png | |||
File:Add_attribute.jpg | |||
File:Recalculate_excel.JPG | |||
</gallery> | |||
{{Indicator nav}} | |||
[[Category: Public GeoShare]] | |||
Latest revision as of 16:11, 2 February 2023
The Wind turbine indicator calculates the amount of wind turbines in the project area and the amount of generated power in MW. The amount is calculated by comparing the current situation and the planned situation. By setting a target value it is possible to experiment with scenarios for renewable energy in the project area. For example, the target for the generated power in the project area is 10 MW. This target then needs to be reached by planning both large and normal wind turbines in the project area. The target value and the amount of power per type of wind turbine is adjustable, which makes this indicator scalable for different types of projects.
This indicator is for example useful for projects in where:
(one of the) goals is to work on reaching a certain renewable energy target different spatial plans are compared using the 3D Visualization the project area should become climate adaptive
This Excel indicator can be downloaded from the Public GeoShare. Read on to find out more about the indicator's calculation method and how to set it up in your project.
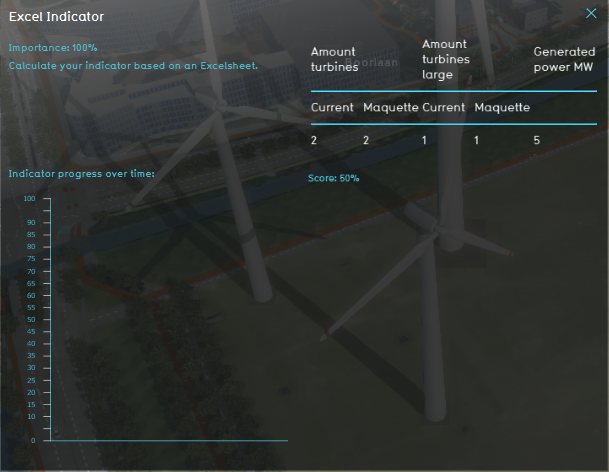
Indicator panel
The indicator panel shows the following information:
- The amount of current turbines
- The amount of current large turbines
- The amount of planned turbines
- The amount of planned large turbines
- The total amount of generated power in MW
- The score per area
Calculation
The indicator calculates the amount of wind turbines in order to calculate how much MW is generated. The normal size turbine generates 1 MW and the large turbine generates 3 MW. The amount of MW generated per turbine is based on this source [windcentrale]. The following formula is used:
(amount of turbines normal * 1MW) + (amount of turbines large * 3MW)= total amount of MW
Score
The score is represented in a progress bar, with a scale from 0 to 100%.
Additional configurations
For this indicator, the Global POWER_TARGET needs to be added. Also the Attribute POWER needs to be added to the functions "Windmill" and "Windmill (Large)" in the function values table See below for the steps:
Add the global
The target is set in a Global. To learn more about what a global is, please go to the Globals page.
- Select the Current situation and then hover over the TQL Queries button in the ribbon header.
- Click on the Add Global button in the hover panel. A new global named VARIABLE will be added to the left panel.
- Select the global VARIABLE.
- In the right panel, change the name to POWER_TARGET.
- Change the start value to a number representing your total target.
- Hover over the Auto update icon and choose for Reset to Start values (faster) to update your project.
Add the attribute
The generated power per type of wind turbine is set in the function values table. To learn more about this table, please go to the function values table page.
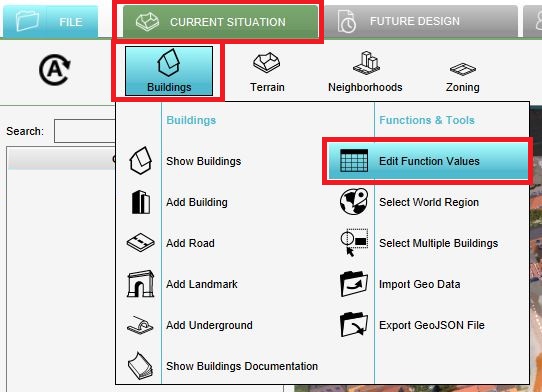
- Select the Current tab and hover over the Buildings button in the ribbon header
- Click on Edit function values in the hover menu.
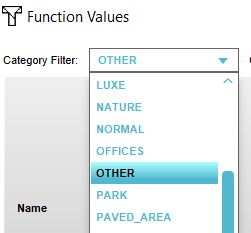
- Set the Category filter on Other
- Click in the left bottom corner on the Add button after Function
- In the new panel, choose the Windmill function and click on Apply.
- Repeat the steps 3 and 4 for the Windmill large function
- Now write in the left bottom corner after Attributes, the new attribute name: POWER and click on Add. The new attribute POWER is created.
- Search for the attribute POWER in the table and set the desired values for each type of windmill by clicking two times on the value and entering a new value.
- Hover over the Auto update icon and choose for Reset to Start values (faster) to update your project.


