Demo Rainfall Project: Difference between revisions
mNo edit summary |
mNo edit summary |
||
| Line 39: | Line 39: | ||
===Measuring tool=== | ===Measuring tool=== | ||
[[File:demo_water_tomeasure.jpg|left]] | |||
[[File:demo_water_measurement.jpg|thumb|right|300px|Using a properly configured measuring tool allows for detailed insight into water levels.]] | [[File:demo_water_measurement.jpg|thumb|right|300px|Using a properly configured measuring tool allows for detailed insight into water levels.]] | ||
More in-depth analysis of water in the project can be achieved using the [[Measuring tool]]. Go to the X popup in the project, and place a point measurement anywhere to see a graph of the waterlevels in that location during the simulation. | More in-depth analysis of water in the project can be achieved using the [[Measuring tool]]. Go to the X popup in the project, and place a point measurement anywhere to see a graph of the waterlevels in that location during the simulation. | ||
Revision as of 09:58, 17 January 2020
| Next page>> |
About the project
The Demo Kockengen project is available for all users and can be found in the main menu under Edit projects. This project does not count towards your license. The demo is a working project in which a location in The Netherlands is subjected to an excessive amount of rainfall. It can serve to explore some features of the rainfall functionality of the Water Module, including the project-wide precipitation, evaporation, and measuring the subtle amounts of resulting inundation.
This project is based on the completed version of the Rainfall Overlay tutorial. To learn how the project was created, please follow the Rainfall Overlay tutorial.
Rainfall
The project simulates rainfall, beginning with a 2 hour period of rain followed by a dry period allowing the water to settle and evaporate. The project offers a number of points of interest to inspect in greater detail.
Puddle formation
At the location of the blue popup, water will begin to amass during the simulation. Rainfall causes water to build up across the project, but due to differences in elevation some places will remain effectively dry while other collect water from both the rain there and the runoff of water from other places.
Culverts and weirs
The construction popups in the project indicate the locations of culverts and weirs. These constructions allow water to flow across, which happens automatically when the water levels differ at either side.
The culvert allows water to flow through whenever water exceeds its bottom height. Flowthrough is effectively only limited by its diameter. Flowthrough is calculated by the culvert formula. To see how a culvert is configured, navigate to the following location in the editor:
In the wizard, click on "Next" until you reach the step on "Culverts". There, select any culvert to inspect its attributes. Additionally, you can select "Show in Editor" to have the 3D world zoom to its location. You can do this for any culvert you are interested in.
The weir allows water to flow over it whenever water exceeds its top height. The amount of water that can flow over it is effectively limitless, but dictated by the weir formula. To see how a weir is configured, navigate to the following location in the editor:
In the wizard, click on "Next" until you reach the step on "Weirs". There, select any weir to inspect its attributes. Additionally, you can select "Show in Editor" to have the 3D world zoom to its location. You can do this for any weir you are interested in.
Sewers and sewer overflow
The faucet popup in the project indicates the location of a sewer overflow. A sewer district is defined covering the entire town. This is used as a generic definition for sewer capacity, and to allow roads to have water flow off into the sewer. When the sewer nears capacity, water will begin to flow out through the sewer overflow, back onto the surface.
Navigate to the following location in the editor:
In the wizard, click on "Next" until you reach the step on "Sewers". There, select the "KOCKENGEN" sewer to inspect its attributes. Continue on to the step on "Sewer Overflows". There, select the overflow to inspect its attributes.
Measuring tool
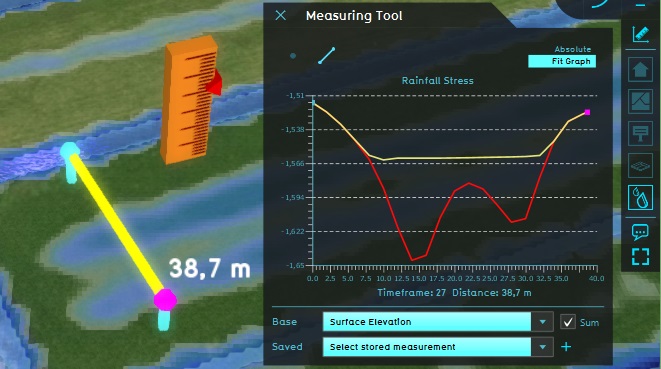
More in-depth analysis of water in the project can be achieved using the Measuring tool. Go to the X popup in the project, and place a point measurement anywhere to see a graph of the waterlevels in that location during the simulation.
You can also place a line measurement, perpendicular across one or multiple canals. You can get a cross-section of the waterlevels relative to datum by doing the following:
- Place a line measurement
- In the "Base" Overlay dropdown, select the "Surface Elevation.
- Check the "Sum" option, to add the values of the two layers together
- Select the "Fit to graph" mode to use the full extent of the measuring window.
The result is a cross-section of the water and the terrain height.
GeoTiff export
Actions
After inspecting the consequences of the defined rainfall, it is possible to explore potential remedies. Note that when any of the actions described here are taken, a testrun will start. This means the editing tools will be temporarily disabled. When you are done experimenting with actions, you can stop the testrun by clicking the stop button in the ribbon. This will revert the session back to its base state, without the effects of the applied action(s).
Weir adjustments
Spatial planning options
Switch the the "Future design" tab, and then in the 3D interface the Action menu will appear. Open the menu with "Water Storage" options, and select the "City park with water storage" action. Now draw a selection in the city, in locations which experiences excessive water retention. When you have made the selection, select "Confirm". The Tygron Platform will recalculate the effects of your action, and the rainfall overlay will show the appropriate new results.
| Next page>> |


