UK Benchmark 5 (Water Module)
This benchmark performs test case 5 of the UK benchmark named Test 5 – Valley flooding as well as its result generated by the Water Module in the Tygron Platform.
This tests a package’s capability to simulate major flood inundation and predict flood hazard arising from dam failure (peak levels, velocities, and travel times).
Description
This test is designed to simulate flood wave propagation down a river valley following the failure of a dam. The valley DEM is ~0.8km by ~17km and the valley slopes downstream on a slope of ~0.01 in its upper region, easing to ~0.001 in its lower region. The inflow hydrograph applied as a boundary condition along a ~260m long line at the upstream end is designed to account for a typical failure of a small embankment dam and to ensure that both super-critical and sub-critical flows will occur in different parts of the flow field, see Figure (b). The model is run until time T = 30 hours to allow the flood to settle in the lower parts of the valley.
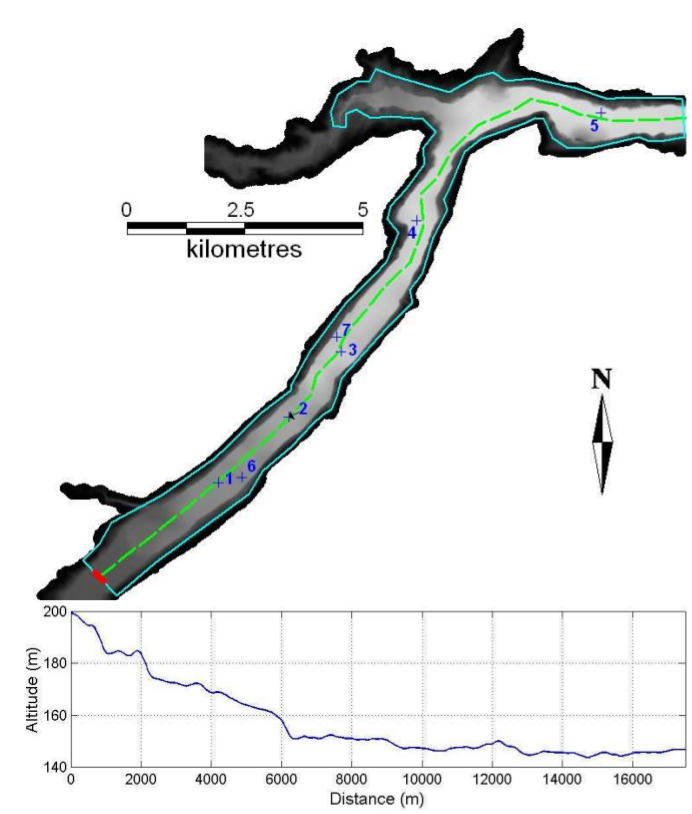
Figure (a): DEM used, with cross-section along the center line, and location of the output points. The red line indicates the location of the boundary condition and the blue polygon is the modeled area. 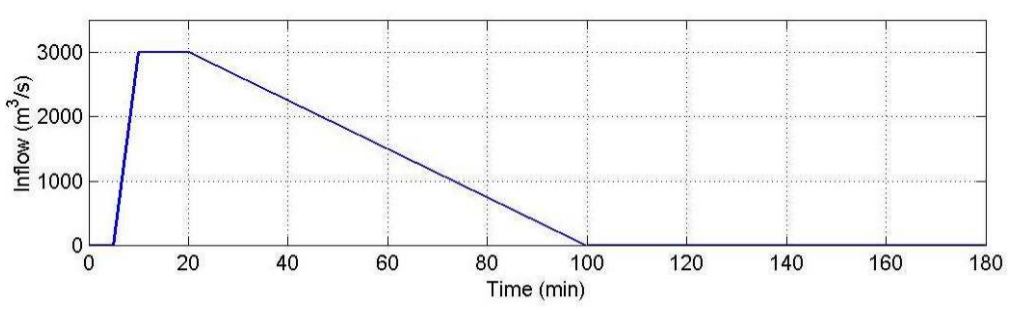
Figure (b): Inflow hydrograph applied in Test 5


Boundary and initial condition
- Inflow boundary condition along the dashed red line in Figure (a). Table provided as part of dataset.
- All other boundaries are closed.
- Initial condition: Dry bed.
Parameter values
- Manning’s n: 0.04 (uniform)
- Model grid resolution: 50m (or ~7600 nodes in the 19.02 km 2 area modelled)
- Time of end: the model is to be run until time t = 30 hours (if an alternative end time is used run times must be reported for t=30 hours)
Required output
Software package used: version and numerical scheme.
Specification of hardware used to undertake the simulation: processor type and speed, RAM.
Minimum recommended hardware specification for a simulation of this type.
Time increment used, grid resolution (or number of nodes in area modelled) and total simulation time to specified time of end.
Raster grids (or TIN) at the model resolution consisting of:
- Peak water level elevations reached during the simulation
- Peak water depths reached during the simulation
- Peak velocities (scalar) reached during the simulation
Water level versus time (suggested output frequency 60s), at seven locations as shown in Figure (a) and provided as part of the dataset.
Velocity versus time (suggested output frequency 60s), at seven locations as shown in Figure (a) and provided as part of the dataset.
Dataset content
| Description | File Name | Notes |
|---|---|---|
| Georeferenced Raster ASCII DEM at resolution 10m | Test5DEM.asc | |
| Upstream boundary condition table (inflow vs. time) | Test5BC.csv | |
| Outline of modelled area (shapefiles) | Test5ActiveArea_region | Broken file, does not contain data... |
| Location of upstream boundary condition (shapefile) | Test5BC_polyline | Broken file, does not contain data... |
| Location of upstream boundary condition (backup text file) | Test5BC_backup.txt | Used instead of upstream boundary shapefile. |
| Location of output points | Test5Output.csv |
Technical setup
The provided ascii height file named Test5DEM.asc is first processed in order to limit the domain according to the provided area shape. Also the no-value heights were converted to 400, which is about the maximum height value seen in the original Test5DEM.asc-file. See the following images:
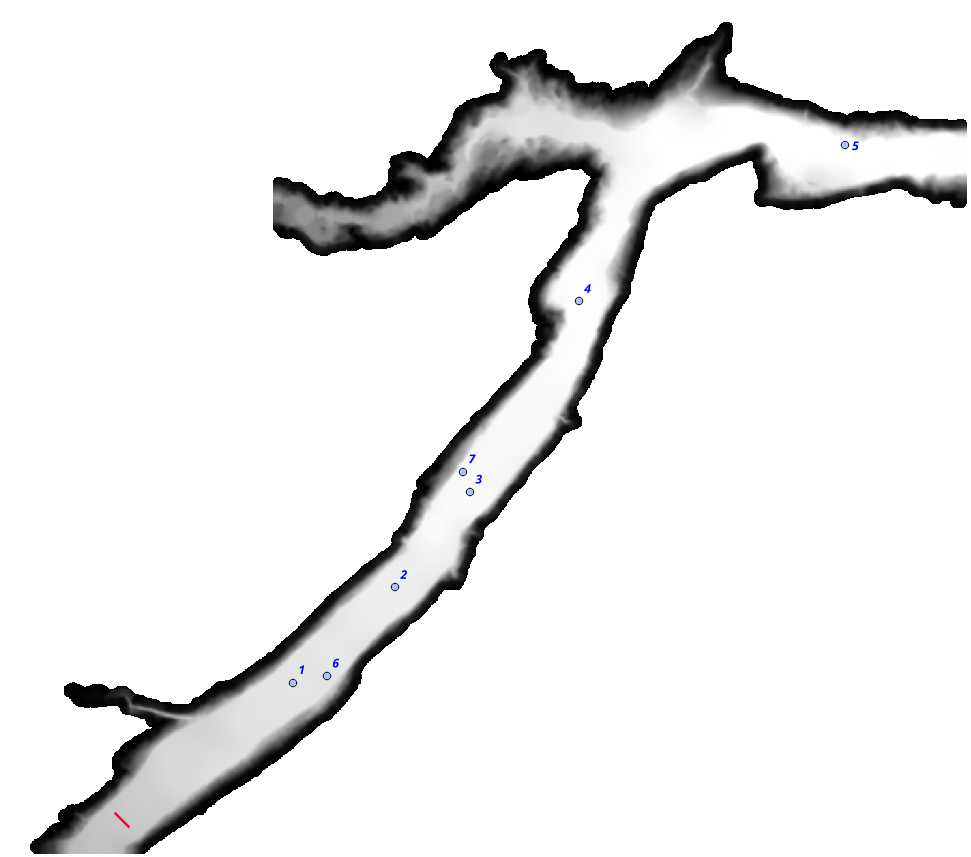
Original Test5DEM.asc 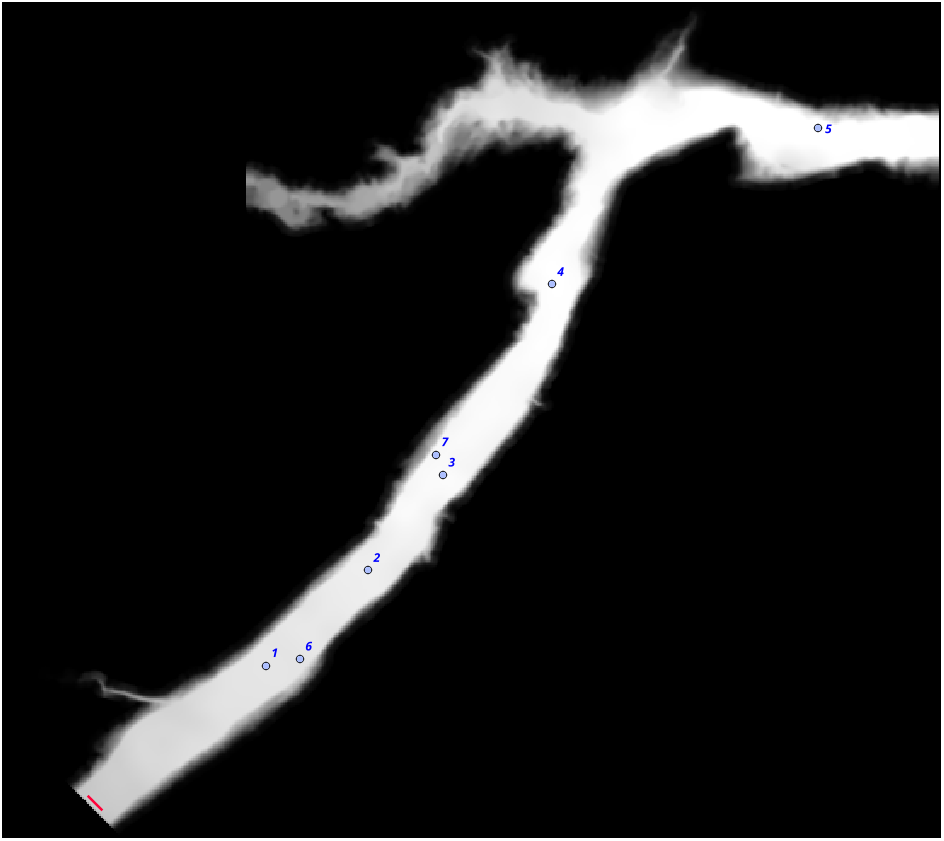
Adjusted Test5DEM.asc


Next, the inlets we placed on the line with coordinates:
| x | y |
|---|---|
| 232595 | 830480 |
| 232785 | 830290 |
Combined with the used grid size of 25 m, this resulted in the usage of 8 individual, single celled inlets. For the location, see the following image.

The inlets were configured as followed:
- External area (m2): 1 000 000 000;
- Water level (m): 1;
- Threshold (m): none;
- Inlet Q (m):
The total inflow was given by the graph in the introduction. We use 8 individual inlets, so therefore the individual amount is 8 times smaller than the total amount. See the image below:

Output as required
- Software package used: Tygron Platform
- Numerical scheme: FV (Kurganov, Bollerman, Horvath)*
- Specification of hardware used to undertake the simulation:
- Processor: Intel Xeon @2.10GHz x 8,
- RAM 62.8 GiB,
- GPU: 2x NVidia 1080
- Operating system: Linux 4.13
- Time increment used: adaptive:
- Grid resolution: 25 m. (not 50 m, but it is at least 50 m)
- Simulation time: 97 seconds for 1800 timeframes (53 seconds for 1 timeframe)
- Inlet q M3: 1.473.027 m3 (9.643.190.03 for 1 timeframe)
- Remaining volume water: 1.473.032 m3 (9.643.242 m3 for 1 timeframe)
Note
- Issue: Inlet flow in less water with the 1800 one minute timeframes, which has to be addressed.


