UK Benchmark 6 (Water Module)
UK Benchmarks
The Benchmark of the UK Environmental Agency (EA, 2013) is used to assess the functioning of the numerical scheme for several cases. The results are described below.
Benchmark 2
description
Engine version: 2019.0.0 DEV 66.0 Date executed: 2018-07-10
Characteristics: A test for the evaluation of an inundation pattern and depth at low momentum over a complex topography:
- Dimensions: 2000m X 200m
- Roughness: uniform manning = 0,03 m/s1/3
- Initial conditions: empty grid
- Resolution: 20m grid
- Boundary condition: Q(t) in North-East side of the model domain
note: the benchmark was executed on a 10m, instead of 20m
File:Inundation benchmark 01.PNG
results
Water levels every 300 secs on the centre of every depression are requested together with a map of the waterdepts at the end of simulation.
The waterdepth at the end of simulation is shown below
File:Inundation benchmark 02.PNG
And graphs of water levels at the centre of every depression:
File:Inundation benchmark 03.PNG
File:Inundation benchmark 04.PNG
Benchmark 3
description
Engine version: 2019.0.0 DEV 68.0 Date executed: 2018-07-11
Characteristics: Test for conservation of momentum over a small obstruction. By inertia (flow changing over time) some water flows over the obstruction.
- Dimensies: zie Figuur below
- Roughness: uniform manning = 0,01 m/s1/3
- Initial condition: 0m water depth
- Resolution: 5m grid
- Boundary condition: Q(t), see figure below
File:Inundation benchmark 05.PNG
results
Results every 2 seconds in the middle of every despression are requested and shown below
File:Inundation benchmark 06.PNG
Benchmark 6
description
Engine version: 2019.0.0 DEV 61.0 Date executed: 2018-07-09
Characteristics:
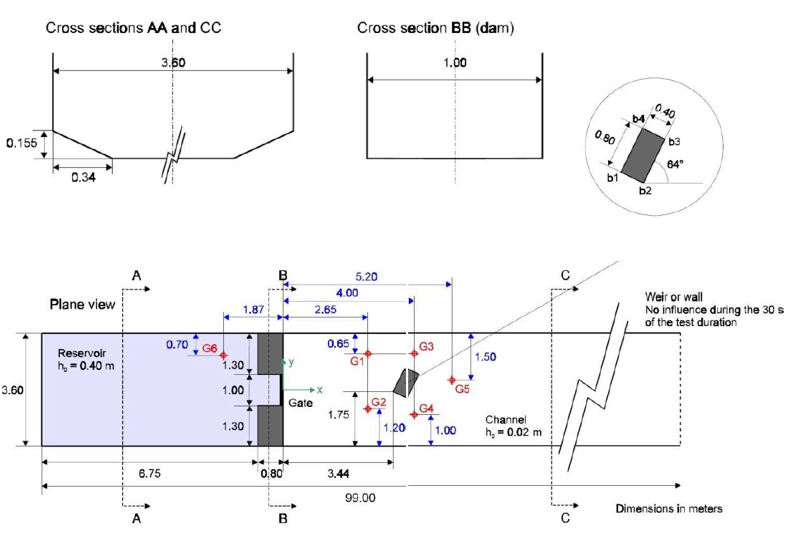
- Dimensions: 20X the values below
- Roughness: uniform manning = 0,05 m/s1/3
- Initiële conditions: 8m in reservoir, 0,4m in floodplain
- Modelgrid resolution: 2m
results
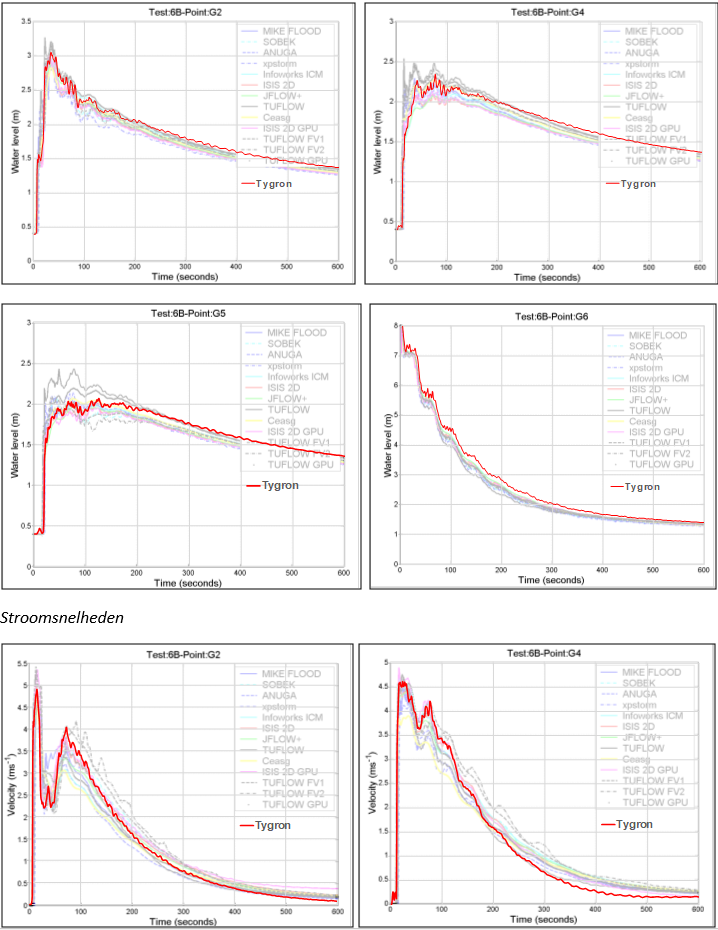
Waterlevels and profiles at the locations indicated in figure above
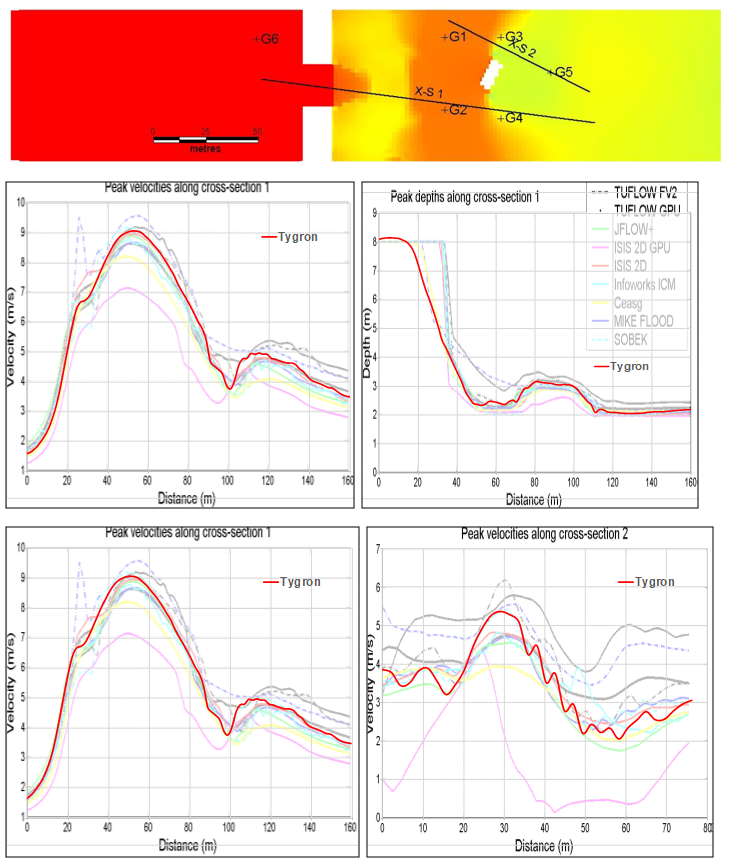
Velocity profiles
References
- Environmetal Agency (2013). Benchmarking the latest generation of 2D hydraulic modelling packages ∙ report Report – SC120002 ∙ found at: https://consult.environment-agency.gov.uk/engagement/bostonbarriertwao/results/appendix-6---neelz--s.---pender--g.--2013--benchmarking-the-latest-generation-of-2d-hydraulic-modelling-packages.-bristol_environment-agency.pdf (last visited 2018-08-03)


