UK Benchmark 1 (Water Module): Difference between revisions
(→Notes) |
|||
| Line 23: | Line 23: | ||
The provided ascii height file named test1DEM.asc is first imported. It has a cell size of 2m, while the test is expected to run on a 10m grid. Therefore, it will be automatically rescaled by the [[Grid Rasterizer|grid rasterizer]]. The resulting rescaled asc file is packed in the {{anchor|test case zip}} down below. | The provided ascii height file named test1DEM.asc is first imported. It has a cell size of 2m, while the test is expected to run on a 10m grid. Therefore, it will be automatically rescaled by the [[Grid Rasterizer|grid rasterizer]]. The resulting rescaled asc file is packed in the {{anchor|test case zip}} down below. | ||
== | ==Output as required== | ||
*Software package used: {{software}} | *Software package used: {{software}} | ||
*Numerical scheme: FV (Kurganov, Bollerman, Horvath)* | *Numerical scheme: FV (Kurganov, Bollerman, Horvath)* | ||
Revision as of 11:34, 17 April 2019
This page contains the test case 1 of the UK benchmark named Test 1 – Uncovering of a beach as well as its result generated by the Water Module in the Tygron Platform.
This test consists of a sloping topography with a depression. An inflow boundary condition is applied at the low end, causing the water to rise to the level indicated by a thick blue line. The inflow is then replaced by a sink term until the water level becomes as indicated by the thin blue line. A similar test has been used by EDF (2000) for validation of the TELEMAC package. The aim of the test is to assess basic package capabilities such as handling disconnected water bodies and wetting and drying of floodplains.
Description

This test consists of a sloping topography with a depression as illustrated in Figure (a). The modeled domain is a perfect 700m x 100m rectangle. A varying water level, see Figure (b), is applied as a boundary condition along the entire length of the left-hand side of the rectangle, causing the water to rise to level 10.35m. This elevation is maintained for long enough for the water to fill the depression and become horizontal over the entire domain. It is then lowered back to its initial state, causing the water level in the pond to become horizontal at the same elevation as the sill, 10.25m.


Boundary and initial conditions
Varying water level along the dashed red line in Figure (a). Table provided as part of dataset. All other boundaries are closed.
Initial condition: Water level elevation = 9.7m.
Parameter values
- Manning’s n: 0.03 (uniform)
- Model grid resolution: 10m (or 700 nodes in the area modelled)
- Time of end: the model is to be run until time t = 20 hours
Technical setup
The provided ascii height file named test1DEM.asc is first imported. It has a cell size of 2m, while the test is expected to run on a 10m grid. Therefore, it will be automatically rescaled by the grid rasterizer. The resulting rescaled asc file is packed in the down below.
Output as required
- Software package used: Tygron Platform
- Numerical scheme: FV (Kurganov, Bollerman, Horvath)*
- Specification of hardware used to undertake the simulation:
- Processor: Intel Xeon @2.10GHz x 8,
- RAM 62.8 GiB,
- GPU: 2x NVidia 1080
- Operating system: Linux 4.13
- Time increment used: adaptive: 0.25 - 1.13 s.
- Grid resolution: 10 m.
- Simulation time: 28s.
Measured point graphs are displayed below:
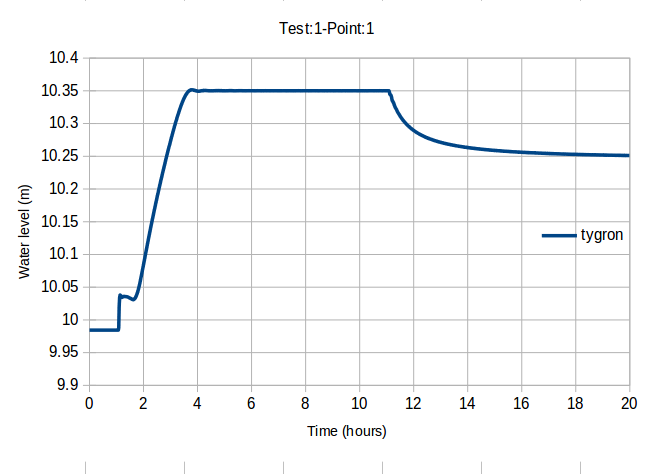
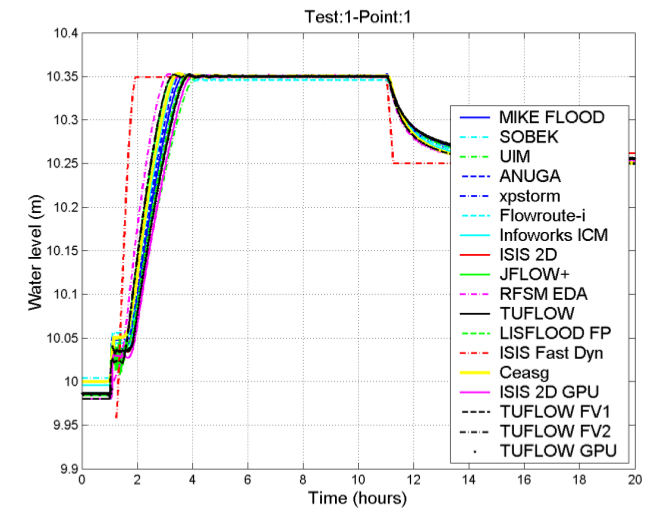
- Graph of point 1 generated by Tygron Platform on the left and generated by others on the right.
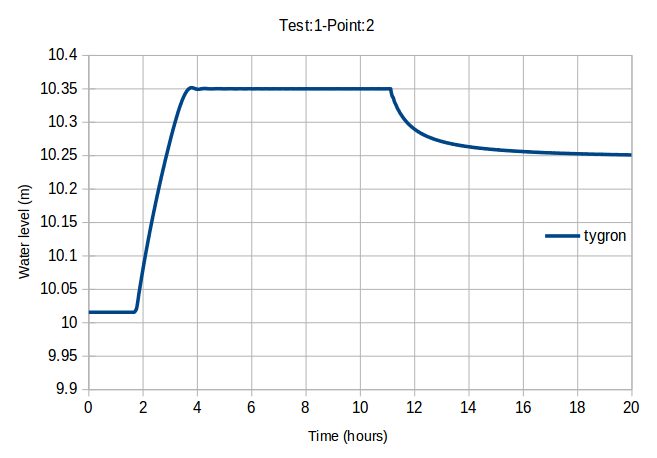
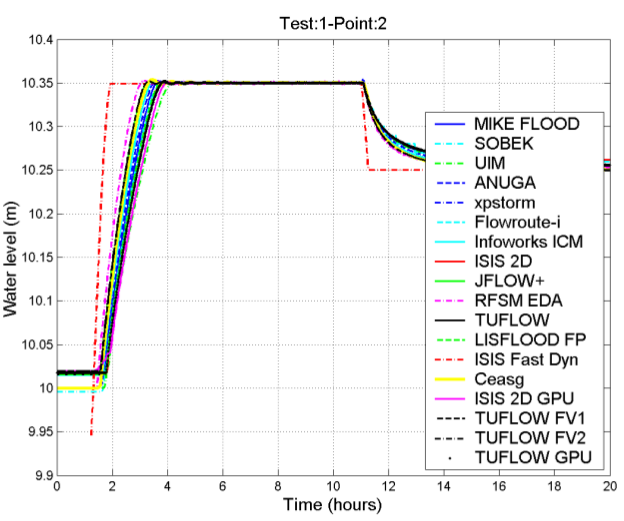
- Graph of point 1 generated by Tygron Platform on the left and generated by others on the right.


Notes
- Tests are run with multi gpu setup. For small cases like this, running it on a single gpu is actually faster: 17 seconds, which is +- 40% compared to 2.