Overlay: Difference between revisions
mNo edit summary |
|||
| Line 39: | Line 39: | ||
: ''This overlay displays the impact of traffic air polution (nitrogen dioxide) on the surrounding area. It becomes available for all stakeholders when added to a project. | : ''This overlay displays the impact of traffic air polution (nitrogen dioxide) on the surrounding area. It becomes available for all stakeholders when added to a project. | ||
<br clear=all> | <br clear=all> | ||
====Distance Zone==== | |||
[[File:Safety Zone-Overlay.jpg|thumb|left|Optional Distance Zone overlay]] | [[File:Safety Zone-Overlay.jpg|thumb|left|Optional Distance Zone overlay]] | ||
: ''Main article: [[Distance Zone (Overlay)|Distance Zone (Overlay)]]. | : ''Main article: [[Distance Zone (Overlay)|Distance Zone (Overlay)]]. | ||
: ''This overlay displays the Distance Zone as defined by [[constructions]]. The overlay becomes available for all stakeholders when added to a project.'' | : ''This overlay displays the Distance Zone as defined by [[constructions]]. The overlay becomes available for all stakeholders when added to a project.'' | ||
<br clear=all> | <br clear=all> | ||
====Sight Distance Zone==== | ====Sight Distance Zone==== | ||
[[File:Sight_Distance_overlay.jpg|thumb|left|Optional Sight Distance Zone overlay]] | [[File:Sight_Distance_overlay.jpg|thumb|left|Optional Sight Distance Zone overlay]] | ||
Revision as of 07:23, 12 July 2017
What are overlays
An overlay is a layer drawn over a visualization to illustrate different properties. They do not contain all the information of a given visualization, but serve as a supplement. By adding these properties onto the same view, the additional information can immediately be made understandable in the same way. A reason to split information off into other layers in this fashion can be to avoid overwhelming a user with too much information.
How do overlays relate to the Tygron Engine interface
Overlays are implemented in the Tygron Engine as part of the interface. Properties such as ownership and zoning are important pieces of information to the user, but would be very overwhelming to display at all times. Instead, a user can activate on overlay to make these pieces of information visible. In principle, all spatially varied information is accessible as an overlay.
How to access overlays in a project
Overlays available to stakeholders appear as buttons just below the minimap. To switch to a specific overlay, use the button to switch to the designated overlay. To switch back to the default view, switch to the "City" overlay. Some overlays are default available when a project is created, see default available overlay types. Some overlays are very closely related to indicators (heat stress and livability) and can not be used separately.
Default overlays
Multiple types of overlay exist in the Tygron Engine. All overlays which are available by default when creating a project are described below.
City

- The default view. This displays the project detail area in natural colors. Hovering over a location displays properties of the construction or land type in that location.
Zoning

- This overlay is available by default. This overlay displays the zoning plan for the entire project detail area. This is helpful when considering indicators which are scored per zone, and when looking to construct a building which is restricted to certain zones.
Property

- This overlay is available by default. This overlay displays the ownership of properties across the entire project area, using each stakeholder's colors. This is important when considering which stakeholder may perform actions such as constructing or demolishing at a given location, or whom to negotiate with for land transactions.
Grid overlays
Traffic Noise

- Main article: Traffic Noise (Overlay).
- This overlay displays the impact noise polution of traffic has on the surrounding area. It becomes available for all stakeholders when added to a project.
Traffic NO2 (Air polution effect)

- Main article: Traffic NO2 (Overlay).
- This overlay displays the impact of traffic air polution (nitrogen dioxide) on the surrounding area. It becomes available for all stakeholders when added to a project.
Distance Zone

- Main article: Distance Zone (Overlay).
- This overlay displays the Distance Zone as defined by constructions. The overlay becomes available for all stakeholders when added to a project.
Sight Distance Zone
- Main article: Sight Distance Zone (Overlay).
- This overlay combines the Distance Zone as defined by constructions with the direct line of sight for these constructions. The overlay becomes available for all stakeholders when added to a project.
Heat
- Main article: Heat (Overlay).
- This overlay displays the Heat Stress. The overlay displays the average temperature deviation (positive or negative) for the project area, giving an indication of where the most heat-stress is occurring. This overlay only becomes available for each stakeholder with an interest in the Heat Stress indicator. In other words, the overlay is only visible when the heat indicator is also active for the selected stakeholder.
Livability

- Main article: Livability (Overlay).
- This overlay displays the average livability for each part of the project detail area, giving an indication whether the livability is good, average or bad. This overlay becomes available for each stakeholder with an interest in the livability indicator. In other words, the overlay is only visible when the livability indicator is also active for the selected stakeholder.
Rainfall

- Main article: Rainfall (Overlay).
- This overlay calculates the flow of water across the 3D world both above ground and underground, to provide insight into inundation intensities and durations. This is an expert hydrology module. It becomes available for all stakeholders when added to a project.
Other overlays
Terrain Flooding

- Main article: Terrain Flooding (Overlay).
- This overlay displays active flooding areas. This overlay becomes available for each stakeholder.
Areas
- Main article: Areas (Overlay).
- The Areas overlay displays a combination of selected active areas. This overlay becomes available for each stakeholder.
Function Highlight
- Main article: Function Highlight (Overlay).
- This overlay highlights all constructions in the 3D world, for which the specific function has been selected, such as all shops in an area.
Custom Color Areas
- Main article: Custom Color Area (Overlay).
- This overlay shows colored areas in the 3D world, in locations defined in the editor.
Vacancy

- Main article: Vacancy (Overlay).
- This overlay shows all constructions in the project area which have been set as vacant in the Editor.
Image
- Main article: Image (Overlay).
- This overlay projects a custom image over the project area.
Online GIS data
- Main article: Online GIS data (Overlay).
- This option enables users to import private or public available GIS data sets as an overlay.
Traffic Flow
- Main article: Traffic Flow (Overlay).
- This overlay displays the flow of traffic through roads. It becomes available for all stakeholders when added to a project.
Adding and removing overlays
Adding and removing overlays is a generic process, however, certain overlays are dependent on other assets being present too, such as indicators, terrains, vacancy, images, etc. For more information please refer to the respective main articles for the specific overlays.
- Select in the editor '3D World' from the ribbon
- Select 'Overlays' > 'Edit overlays' from the ribbon bar
- Select the desired overlay'*' from the drop down menu on the bottom of the left panel
- Select 'Add' from the bottom of the left panel
- Fill in parameters on the right panel, as required for some overlays
- The overlay icon will now appear under the mini map'**'
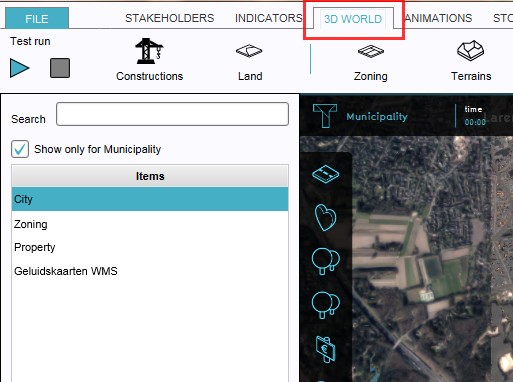
1. Select 3D World
- SelectEditOverlay.jpg
2. Select Overlays > Edit overlays
- SelectDropDown.jpg
3. Select desired overlay from drop down menu on the bottom of the left panel
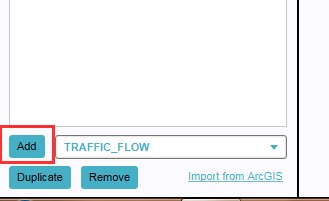
4. Select 'Add' from the bottom of the left panel
- OverlayParameters.jpg
5. Fill in parameters on the right panel (required for some overlays)
- OverlayIconPresent.jpg
6. The overlay icon will now appear under the mini map


- Select in the editor '3D World' from the ribbon
- Select 'Overlays' > 'Edit overlays' from the ribbon bar
- Select the desired overlay'*' from the list of active overlays'**' on the left panel
- Select 'remove' from the bottom of the left panel
- Confirm the removal in the pop up confirmation message
1. Select 3D World
- SelectEditOverlay.jpg
2. Select Overlays > Edit overlays
- SelectOverlay.jpg
3. Select desired overlay from the list of active overlays on the left panel
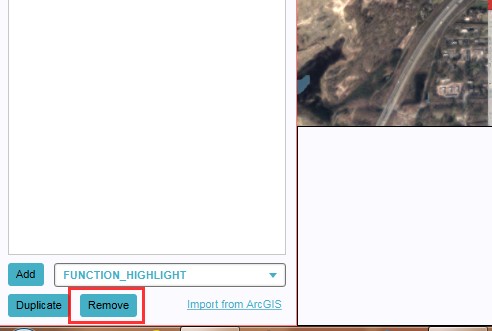
4. Select 'Remove' from the bottom of the left panel
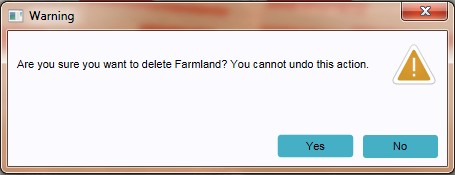
5. Confirm the removal in the pop up confirmation message

Sometimes it can be convenient to duplicate an already existing overlay. To do so, follow the steps for removal, but select 'Duplicate' in stead of 'Remove'.
'*' The default City, Zoning and Property overlays are already present when creating a new project in the editor. However, they can be removed and added later again.
'**'The Heat and Livability overlays can only be added to selected stakeholders as part of the heat and livability indicators, assigned to said stakeholders. These overlays are automatically added when adding the paired indicator, and removed along with the indicator again. See also: Indicators.