Handout Quickstart: Difference between revisions
No edit summary |
|||
| Line 45: | Line 45: | ||
===Overlays=== | ===Overlays=== | ||
Overlays are 2D maps, visible on top of the 3D world. | |||
* By default, several overlays are added to the Overlay bar. Click on the Neighborhoods overlay to see the CBS wijk- en buurtkaart. By clicking on one of the neighborhoods you will see statistigs about the neighborhood from the CBS in the hover panel. | |||
* By clicking on the house icon (named the City OVerlay), you will return to the normal 3D world. | |||
* The bord icon shows the Property overlay. | |||
* There are a lot more overlays which can be added. This can be done as follows: Click on the Current Situation tab and hover over the Overlays button. Then add for example the Traffic noise from the Environment category. Now a map wich whose the noise distrubacen by traffic is added. | |||
* This overlay is a dynamic overlay or grid overlay. The map is divided into grid cells. On each grid cell a value is calculated (in this case the noise disturbance of the traffic in dB). The smaller the grid cells are, the more accurate the overlay is. Change the grid cell size of the overlay by selecting hte overlay from the left panel and then clicking on CHange grid in the right panel. | |||
* When Auto updae is on, the overlay is automatically being recaluclated. When auto update is off, after changing the grid cell value click on Update now in the right panel (below CHange grid). | |||
5. Als Auto update aan staat, wordt de overlay automatisch herberekend. Als auto update uit staat, kun je na het veranderen van de grid grootte klikken op Update now in het rechterpaneel (onder Change grid). | |||
6. Ga nu naar de Current Situation tab, hover over de knop Overlays en klik op Add Rainfall om de Rainfall overlay toe te voegen. In het linkermenu zie je dat de Regenwater Overlast overlay is toegevoegd aan je project. | |||
Revision as of 15:07, 15 June 2021
This handout can be used for a quickstart training about the Tygron Platform.
How to use: Advise is to print this handout and use it during the advanced training to take notes on. Afterwards, you will have a summart of what you have learned during the training.
Note: This handout is not a complete standalone tutorial but provides a guide for during a training. To learn more about the
The subjects in this hand out are:
- Domain management
- Create new project
- Save, versions and user rights and User interface
- Overlays
- Buildings
- Indicators
- Actions
Domain management
- Log in with your user name and password on the Tygron Platform, the LTS.
- Click in the main menu on Options. When you are domain manager, you will see more options since you have extra rights such as adding new users and removing projects from the domain.
- Click on My Account. In this menu you can change the (automatically generated) password.
- You can also change the rights of projects which you have created. A project can have read rights (right to only open the project, but not save edits), writhe (rights to edit and save edits) and none (the project is not visible for users and they cannot access it). Also it is possible to change the version of your project.
Create New Project
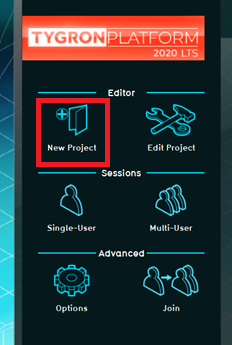
- Click in the Main Menu on New Project
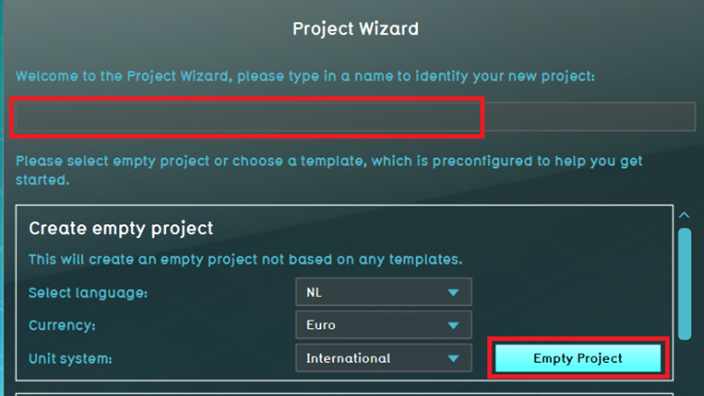
- Provide a name for the New Project (max 20 characters) and click on Empty Project.
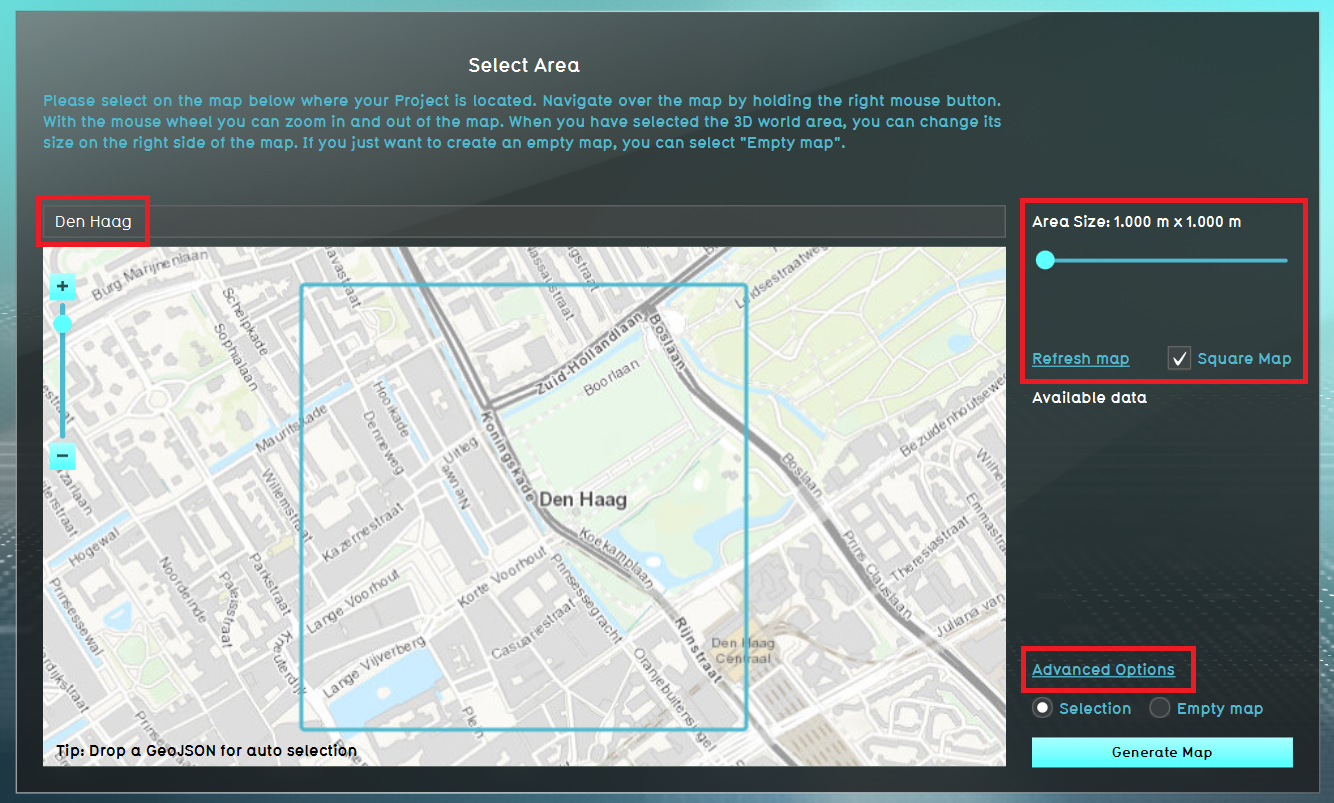
- For the location, fill in a location of your choice and click on Enter. Move the square with the left mouse button. The area of the map in the square will be your 3D world. With the sliders on the right side, it is possible to enlarge the square. However, the smaller the square is, the faster the 3D world will be generated. For the following steps, choose a size of max 2 x 2 km.
- Then click on Advanced Options
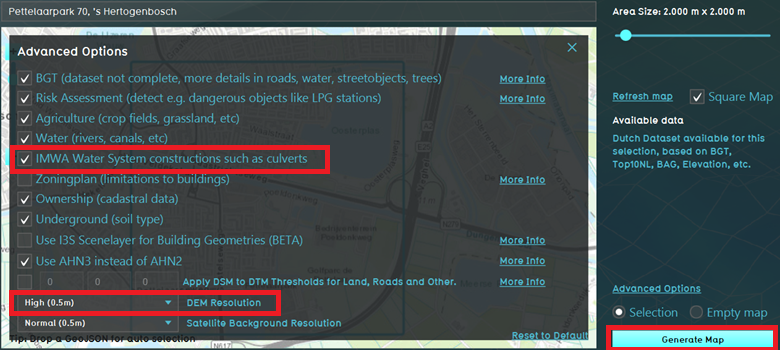
- Here you can check datasets that are used to generate the 3D world.
- Finally click on generate map to generate the 3D world from open data.
Save, versions and user rights and User interface
- Once you first get in the project, the project starts with a Cinematic (flythrough over the project area).
- The Editor interface (recognizable by the white menus around the 3D world) is divided into the Ribbon, the Left Panel, Right Panel and Bottom Panel.
- Click on the File button in the upper left corner to go to the main menu of the project.
- In the Edit rights section you can change the rights. By default the owner is the only person which has access to the project and can edit and save the project. Change the rights in the Other users domain section in order for other users in your domain to access your project. When you have a Support question and would like Tygron to take a look into your project, you can change the rights for Tygron Support. By default Tygron does not have access to your project.
- In the Save menu you can save the project.
- In the Versions menu you can add a new version. Change (if desired) the name of the version. It is strongly advised to work with different versions when editing a project, so you will always have a fallback.
- Click on the arrow to go back to the project.
- In the interface you will see the Current Situation tab, in where you can edit the current situation of the model. In the black bar on the right you will see the 2D maps, named Overlays.
- Click on the Future design tab to see new buttons. With the menus in this tab it is possible to create scenarios by building and demolishing.
- If you have a question while using the software, go to the Community tab to open the Wiki to find the documentation. If your question is not answered with information on the Wiki, go to the Forum to post your question.
Overlays
Overlays are 2D maps, visible on top of the 3D world.
- By default, several overlays are added to the Overlay bar. Click on the Neighborhoods overlay to see the CBS wijk- en buurtkaart. By clicking on one of the neighborhoods you will see statistigs about the neighborhood from the CBS in the hover panel.
- By clicking on the house icon (named the City OVerlay), you will return to the normal 3D world.
- The bord icon shows the Property overlay.
- There are a lot more overlays which can be added. This can be done as follows: Click on the Current Situation tab and hover over the Overlays button. Then add for example the Traffic noise from the Environment category. Now a map wich whose the noise distrubacen by traffic is added.
- This overlay is a dynamic overlay or grid overlay. The map is divided into grid cells. On each grid cell a value is calculated (in this case the noise disturbance of the traffic in dB). The smaller the grid cells are, the more accurate the overlay is. Change the grid cell size of the overlay by selecting hte overlay from the left panel and then clicking on CHange grid in the right panel.
- When Auto updae is on, the overlay is automatically being recaluclated. When auto update is off, after changing the grid cell value click on Update now in the right panel (below CHange grid).
5. Als Auto update aan staat, wordt de overlay automatisch herberekend. Als auto update uit staat, kun je na het veranderen van de grid grootte klikken op Update now in het rechterpaneel (onder Change grid). 6. Ga nu naar de Current Situation tab, hover over de knop Overlays en klik op Add Rainfall om de Rainfall overlay toe te voegen. In het linkermenu zie je dat de Regenwater Overlast overlay is toegevoegd aan je project.


