Demo Seepage Project
| Next page>> |
The Demo Seepage project is available for all users and can be found in the main menu under Edit projects. This project does not count towards your license.
This project is intended for hydrologists and other water experts.
This project showcases the seepage functionality.
The demo is a working project in which a location in The Netherlands is experiencing seepage. In this project seepage calculations are made under different circumstances which leed to different scenarios.
Exploring the project
To begin exploring the project, take the following steps:
- Click anywhere in the 3D world, and use the arrow keys on your keyboard to move around in the world. You can also drag the camera around by right-clicking (and holding the right mouse button down) in the 3D world and dragging the world around. Use the scroll wheel to zoom in- and out.
- On the right-hand side of the 3D world you can see the overlays menu. Hover over the various icons to see a tooltip with their name. Find the overlay named "Groundwater (spatial)", and click on it. This will show the overlay in the 3D world. This overlay shows the groundwater level in the underground.
- At the bottom of the interface a legend will now appear, with on the left-hand side of the legend a few buttons to "play" the overlay. Click on the "play" button, and you will see how the state of the groundwater level changes over time.
- Hover over the icon for the overlay again, and notice that more options appear for overlays related to groundwater. These are the child overlays, which can display more types of results from the groundwater simulation.
- Notice multiple Overlays exist, each showing a specific result or type of data related to seepage:
- The "Groundwater (Spatial)" Overlay calculates and shows the result for the seepage calculation, with a static amount of pressure and resistance affecting the groundwater levels, without any configured fluctuation.
- The "Groundwater (Fluctiation)" Overlay calculates and shows the results for a seepage calculation, in which natural pressure and resistance are configured to limit base seepage, so that only the effect of seepage fluctuation is demonstrated.
- A GeoTiff Overlay showing spatial seepage pressures.
- A GeoTiff Overlay showing spatial seepage resistances.
- Finally, notice a number of icons floating in the world. The orange icons are of particular note; these denote points-of-interest which you can take a closer look at. You can click on any to open a panel with more information.
Points of interest
The project offers a number of points of interest to inspect in greater detail. A number of these points have been emphasized with popups.
Seepage under land
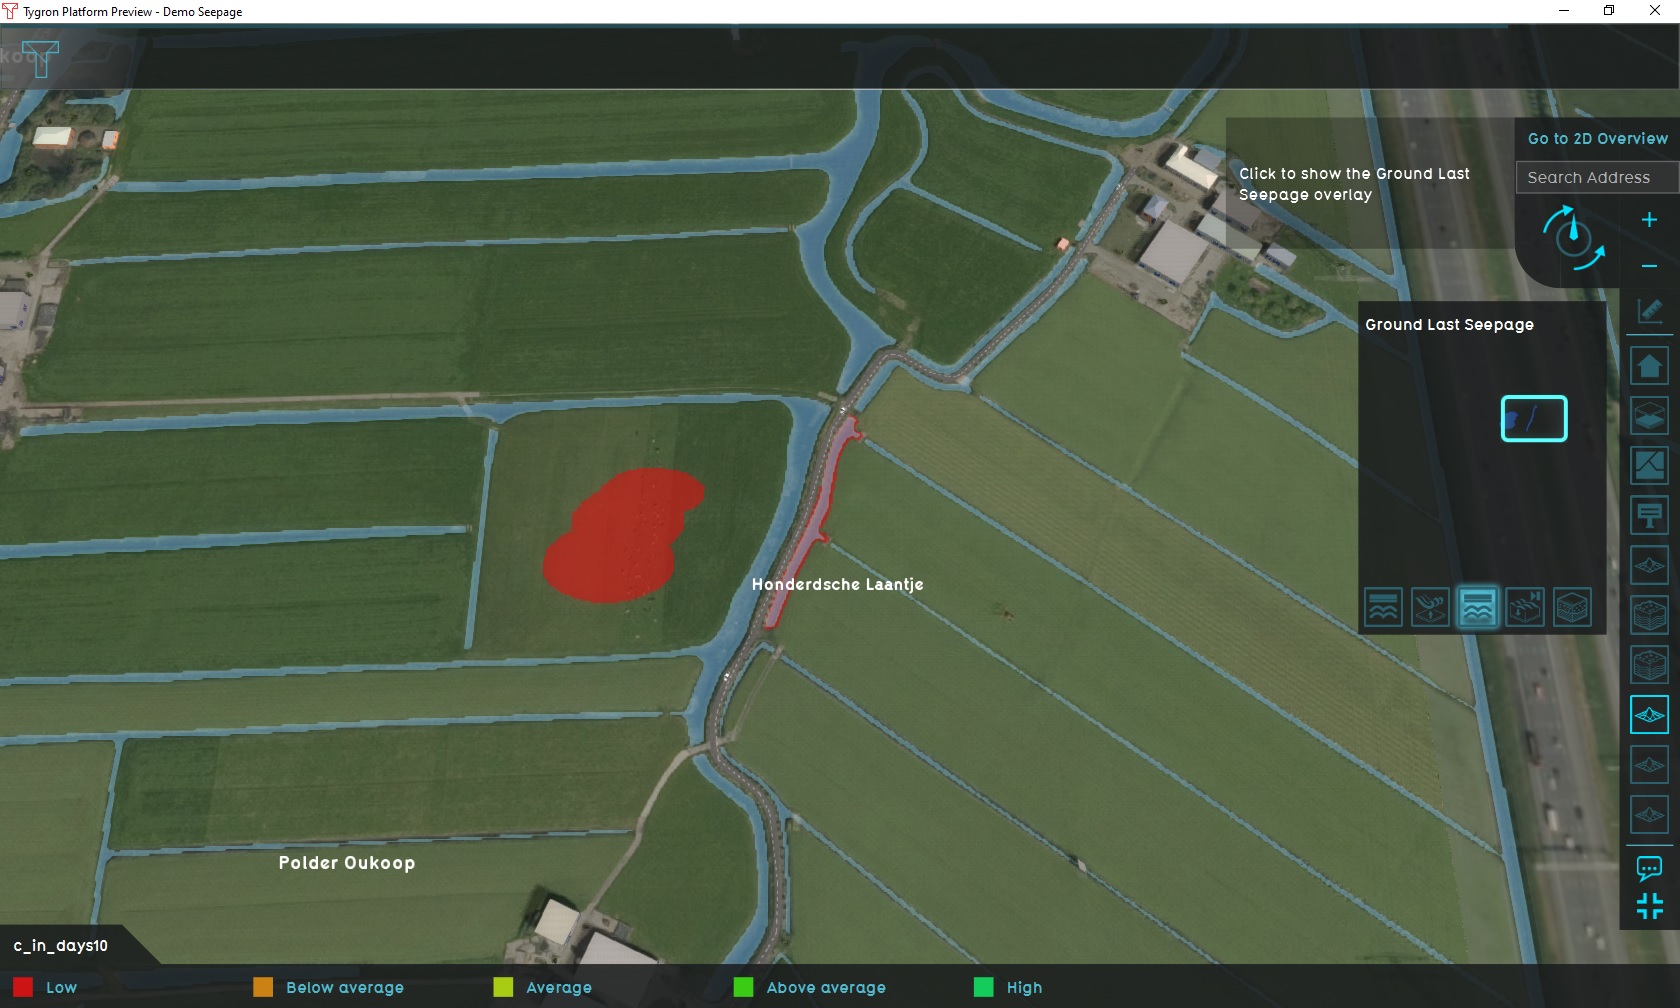
At the location of this popup, underground pressure will cause seepage to occur, slowly increasing the groundwater level.
Select the "Groundwater (Spatial)" Overlay, and play the overlay. As time progresses, the patch of land where seepage occurs will experience a rising groundwater level, until the pressure of the seepage even causes the water to seep onto the surface.
Place a point measurement on the wet patch, and select the "Groundwater (Fluctuation)" Overlay. Play the Overlay. You will see the measurement shows a varying rate at which seepage occurs, entirely dictated by the seepage fluctuation which varies over time.
Seepage under waterway
At the location of this popup, underground pressure will cause seepage to occur under the waterway.
Place a line measurement along the waterway where seepage occurs, and select the "Surface last value (Spatial)" Overlay. Add as a base Overlay the "Surface elevation (Spatial)" Overlay, and select the "sum" mode. Play the overlay. You will see the initial state of the waterway is a dry waterbed. However, as time and seepage progresses, eventually water will seep up from the underground into the waterway.
Using the same measurement, select the "Groundwater (Fluctuation)" Overlay. Disable the "sum" mode. (You do not need to change the base overlay, as both Overlays share the same elevation model.) Play the overlay. You will see the groundwater level rises at a varying rate, entirely dictated by the seepage fluctuation which varies over time.
No seepage
In locations with either no resistance or pressure defined, or with negative resistance defined, no seepage occurs. Both seepage into the project area as well as seepage out of the project area are disabled.
Actions
After inspecting the consequences of the defined rainfall, it is possible to explore potential remedies. Note that when any of the actions described here are taken, a testrun will start. This means the editing tools will be temporarily disabled. When you are done experimenting with actions, you can stop the testrun by clicking the stop button in the ribbon. This will revert the session back to its base state, without the effects of the applied action(s).
Weir adjustments
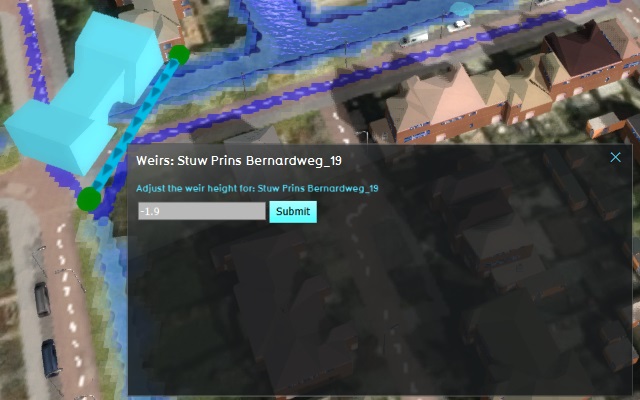
Switch to the "Future design" tab. Select any of the blue weir icons in the 3D world to open a panel which allows you to control them. Specifically, the height of the weir can be changed. Change the weir height to 1 meter lower (e.g., change 3.2 into 2.2, or -1.6 into -2.6), and select "Submit".
After making the change, the rainfall overlay will be recalculated, and the new results will indicate how water would act with the weir set to its new height. To compare the original results and the new results, select the rainfall overlay, and activate its "difference" mode by selecting "Show difference". The overlay will now show where the resulting amounts of water have changed due to your action.
Spatial planning options
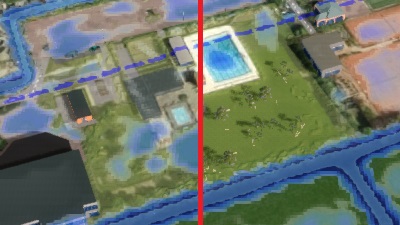
Switch to the "Future design" tab, and then in the 3D interface the action menu will appear. Open the menu with "Water Storage" options, and select the "City park with water storage" action. Now draw a selection in the city, in locations which experience excessive water retention. When you have made the selection, select "Confirm". This will add a new park with water storage facilities to that location in the 3D world.
After making the change, the rainfall overlay will be recalculated, and the new results will indicate how water would act with the new water storage facilities. To compare the original results and the new results, select the rainfall overlay, and activate its "difference" mode by selecting "Show difference". The overlay will now show where the resulting amounts of water have changed due to your action.
| Next page>> |


