CSV (comma separated values): Difference between revisions
| Line 108: | Line 108: | ||
==CSV (comma separated values) and the Tygron Geodesign Platform== | ==CSV (comma separated values) and the Tygron Geodesign Platform== | ||
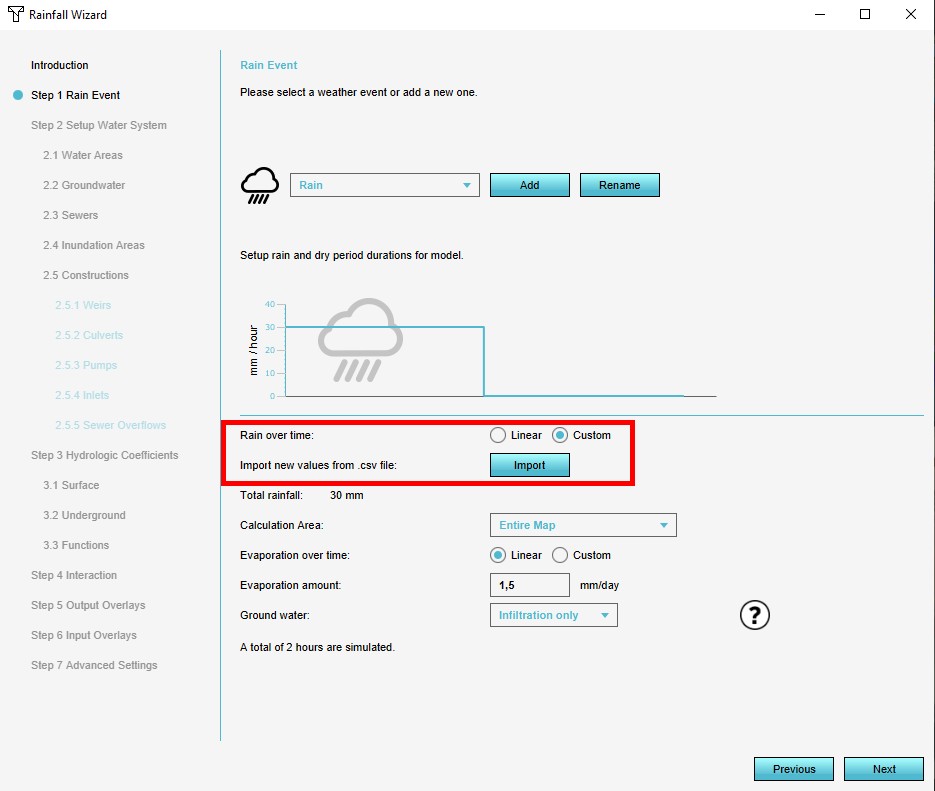
[[File:RainfallRainEvent1.jpg|thumb|right|Rainfall overlay wizard with custom option selected: the "import from CSV"- button is now available.]] | [[File:RainfallRainEvent1.jpg|thumb|right|250px|Rainfall overlay wizard with custom option selected: the "import from CSV"- button is now available.]] | ||
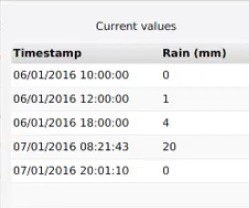
[[File:DynamicRainArray1.jpg|thumb|right|Example of a dynamic rain array (timestamp/ rain in mm)]] | |||
The CSV data structure and files are mostly used in the Tygron Geodesign Plarform as a means to import dynamic overlay attributes. By default, attributes of an overlay, such as rain over time, are generated as a linear event. To incorporate a more dynamic flow of, for example, a dynamic breach area or dynamic period of rain ,a custom option is available where an [[attribute array]] can be uploaded in CSV format. | The CSV data structure and files are mostly used in the Tygron Geodesign Plarform as a means to import dynamic overlay attributes. By default, attributes of an overlay, such as rain over time, are generated as a linear event. To incorporate a more dynamic flow of, for example, a dynamic breach area or dynamic period of rain ,a custom option is available where an [[attribute array]] can be uploaded in CSV format. | ||
It is important to note that such a CSV file containing a dynamic array, can only contain up to a maximum of 10.000 records/ timestamps, to avoid calculations becomming too long or complex. | It is important to note that such a CSV file containing a dynamic array, can only contain up to a maximum of 10.000 records/ timestamps, to avoid calculations becomming too long or complex. | ||
An example of a simple dynamic rain array in seconds as CSV file would look like this: | |||
<pre> | |||
{[width="50%" | |||
Seconds;Rain(mm) | |||
21600;30 | |||
25200;0 | |||
28800;20 | |||
32400;45 | |||
36000;70</pre> | |||
]} | |||
{{clear}} | {{clear}} | ||
Revision as of 11:51, 3 September 2020
What are comma separated values (CSV)?
CSV files are used to transfer data sets between information systems that do not use the same (propriarity) data format. For example, by using the CSV format, data from a data base in a propriarity format can be transferred to a spread sheet program with another propriarity format.
Comma separated values (CSV) is a specification of this tabulated data, where the data is stored on single lines in a text based file and entries are separated with a comma or other character.
In the Anglo Saxon influence sphere, commas are in use as separators. In the rest of the world commas are already in use as decimal separators and periods as thousand-separators. in these regions semi-colos are used in stead of commas.
Another variation is when copying an HTML table into memory. When pasting it in plain text or spreadsheet, the tab character ('\t') is automatically used as separator in stead of a comma or semi-colon.
A CSV file can be created and read with a simple text editor. The file consists of line entries that correspond with the rows in a spreadsheet. Each line (row) has the same number of (column) entries, separated with a comma or other separator. The first line can be used to name column headers of the resulting table. Lines are sometimes ended with only a line feed and no carriage return, which results in the text being displayed in a text editor as one single line without separation per table row. Spreadsheets can ususally read these line feeds without problem, ordering the data in its proper rows again.
Creating a CSV file
We have a simple data set of a list of produce: 10 apples for 0,80 a piece, 5 oranges for 1,20 a piece, 1 tomatoe for 0,75 a piece and 3 onions for 0,50 a piece. We would like to create a table from a CSV file with headers that displays the name, type, color and quantity.
We begin with the first line of column headers:
name; type; quantity; price
Then we add the first data record on the next line:
name; type; quantity; price
apple; fruit; 10; 0,80
Now we add the other entries, resulting in a European CSV file, where the decimal separator is a comma and the value separator is a semicolon:
name; type; quantity; price
apple; fruit; 10; 0,80
orange; fruit; 5; 1,20
tomatoe; vegetable; 1; 0,75
onion; vegetable; 3; 0,50
Save the text file with ".csv" as extention, to save it as a CSV file and not as a regular text file.
This CSV file will result in a similar table as below, when importing the file in a spread sheet program:
| name | type | quantity | price |
| apple | fruit | 10 | 0,80 |
| orange | fruit | 5 | 1,20 |
| tomatoe | vegetable | 1 | 0,75 |
| onion | vegetable | 3 | 0,50 |
An example of the data as a USA/UK CSV file, where the decimal separator is a period and the value separator is a comma:
name, type, quantity, price
apple, fruit, 10, 0.80
orange, fruit, 5, 1.20
tomatoe, vegetable, 1, 0.75
onion, vegetable, 3, 0.50
Which will result in the following table:
| name | type | quantity | price |
| apple | fruit | 10 | 0.80 |
| orange | fruit | 5 | 1.20 |
| tomatoe | vegetable | 1 | 0.75 |
| onion | vegetable | 3 | 0.50 |
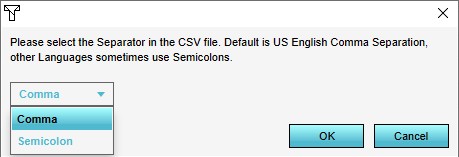
Most programs that can receive CSV files, provide an option to select what to use as separator when importing the file.
CSV (comma separated values) and the Tygron Geodesign Platform
The CSV data structure and files are mostly used in the Tygron Geodesign Plarform as a means to import dynamic overlay attributes. By default, attributes of an overlay, such as rain over time, are generated as a linear event. To incorporate a more dynamic flow of, for example, a dynamic breach area or dynamic period of rain ,a custom option is available where an attribute array can be uploaded in CSV format.
It is important to note that such a CSV file containing a dynamic array, can only contain up to a maximum of 10.000 records/ timestamps, to avoid calculations becomming too long or complex.
An example of a simple dynamic rain array in seconds as CSV file would look like this:
{[width="50%"
Seconds;Rain(mm)
21600;30
25200;0
28800;20
32400;45
36000;70
]}
See also
How to load in dynamic rain and simulation time (Water Overlay)
How to set dynamic breach height
How to load in dynamic evaporation rate (Water Overlay)


