Calculation panel: Difference between revisions
| Line 44: | Line 44: | ||
===Performance overview=== | ===Performance overview=== | ||
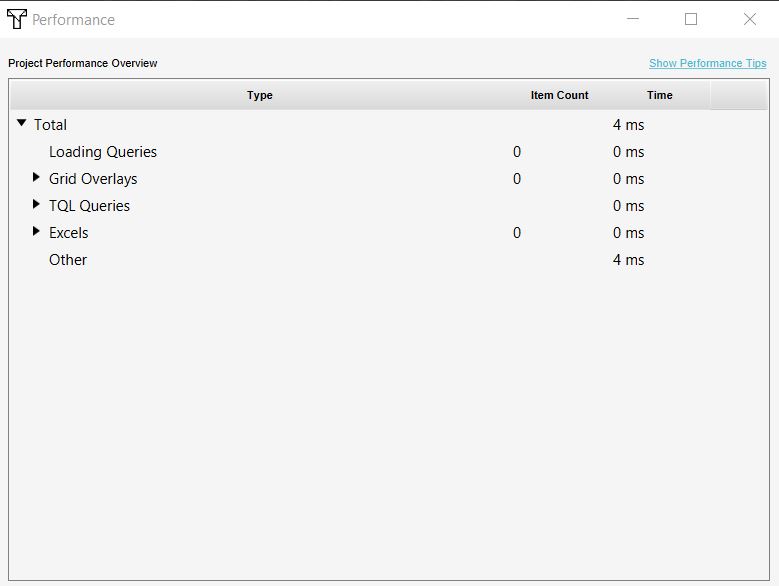
[[File:Performance_overview.JPG|thumb|right|300px|Performance overview panel]] | [[File:Performance_overview.JPG|thumb|right|300px|Performance overview panel]] | ||
The performance overview shows an overview of the components in a project and their calculation time. If your project performance is slow, check the overview to see which component could cause this. | The performance overview shows an overview of the components in a project and their calculation time. If your project performance is slow, check the overview to see which component(s) could cause this. | ||
<br clear=all> | <br clear=all> | ||
Revision as of 08:05, 1 May 2019
Calculation Panel
The Calculation Panel can be found by hovering with your mouse over the arrow icon button.

The options in this panel will allow you to reset how indicators, panels and overlays are being calculated and provides an overview of the calculation time of some of the components in your project.
Auto-update indicators
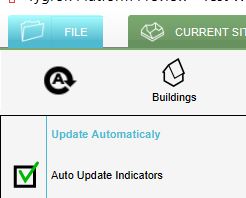
This option is by default turned on and ensures that whenever you make a change in the Editor, the indicators, panels and overlays will be recalculated immediatly. When the auto-update is not checked, you have to manually refresh the project, after making an adjustment, by choosing one of the following two Reset options (see below) or by clicking on the arrow icon.
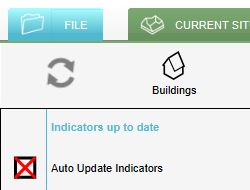
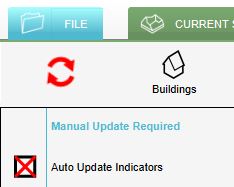
The arrow icon will indicate this by lighting up and the text: Manual Update Required will be visible in the Calculation panel. If no update is required, the text: Indicators up to date will be visible. Compare the three different states below.
Reset to Start Values and Reset X Queries
Below an explanation of the difference between the two options:
Most of the time, in an Indicator Excelsheet X Queries are used. If you have for example three areas in your project, an X query would be as follows:
SELECT....WHERE_AREA_IS_X
In the Tygron Platform this query is translated to the following three queries:
SELECT....WHERE_AREA_IS_0
SELECT....WHERE_AREA_IS_1
SELECT....WHERE_AREA_IS_2
When using Reset to Start Values, for example if you changed an attribute of one of these areas, the three queries are recalculated.
If you choose Reset X Queries, the X Query is again translated to queries. If you for example added a new area, in the Tygron Platform the X Query is then translated to:
SELECT....WHERE_AREA_IS_0
SELECT....WHERE_AREA_IS_1
SELECT....WHERE_AREA_IS_2
SELECT....WHERE_AREA_IS_3
If you used Reset to Start Values in this case, the fourth area was not taken into account, since the three queries would be recalculated again and the Tygron Platform would not translate the X query to other queries.
When to choose which option?
Choose Reset to X Queries if the amount of areas or neighborhoods is changed (for example by adding or removing an area/neighborhood). Choose Reset to Start Values if the amount of areas or neighborhoods stays the same (for example if you only changed an attribute of an area or if you did not use X Queries in your Excelsheet.
Using one of these two option affects all indicators, panels and grid overlays.
Performance overview
The performance overview shows an overview of the components in a project and their calculation time. If your project performance is slow, check the overview to see which component(s) could cause this.
GPU overview
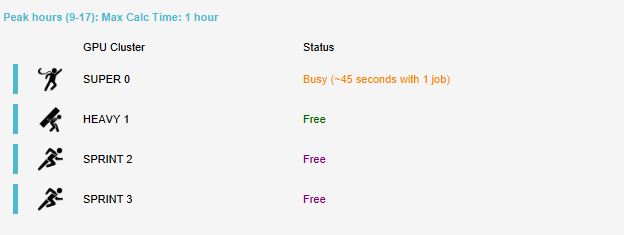
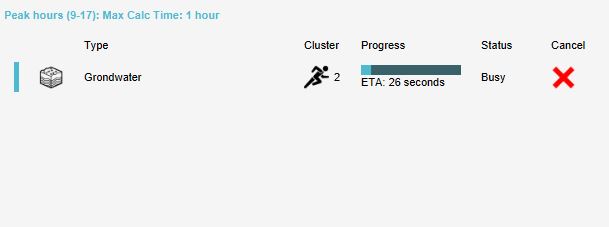
The GPU overview shows the different GPU clusters that are available for calculation and their status. If they are busy with calculating components of another project, it will be visible here. Also your own calculation jobs will be visible in the panel and the possibility to cancel your own calculation(s), by clicking on the cancel icon (see image).
Also take note of the Peak hours (from 9.00h till 17.00h), the maximum calculation time will then be 1h.
