Traffic NO2 Overlay: Difference between revisions
No edit summary |
|||
| Line 1: | Line 1: | ||
{{learned|what the Traffic NO2 overlay is|which information is displayed on the Traffic NO2 overlay | {{learned|what the Traffic NO2 overlay is|which information is displayed on the Traffic NO2 overlay|how to add or remove the Traffic NO2 overlay|}} | ||
==What is the Traffic NO2 overlay?== | ==What is the Traffic NO2 overlay?== | ||
Revision as of 14:25, 13 June 2018
What is the Traffic NO2 overlay?
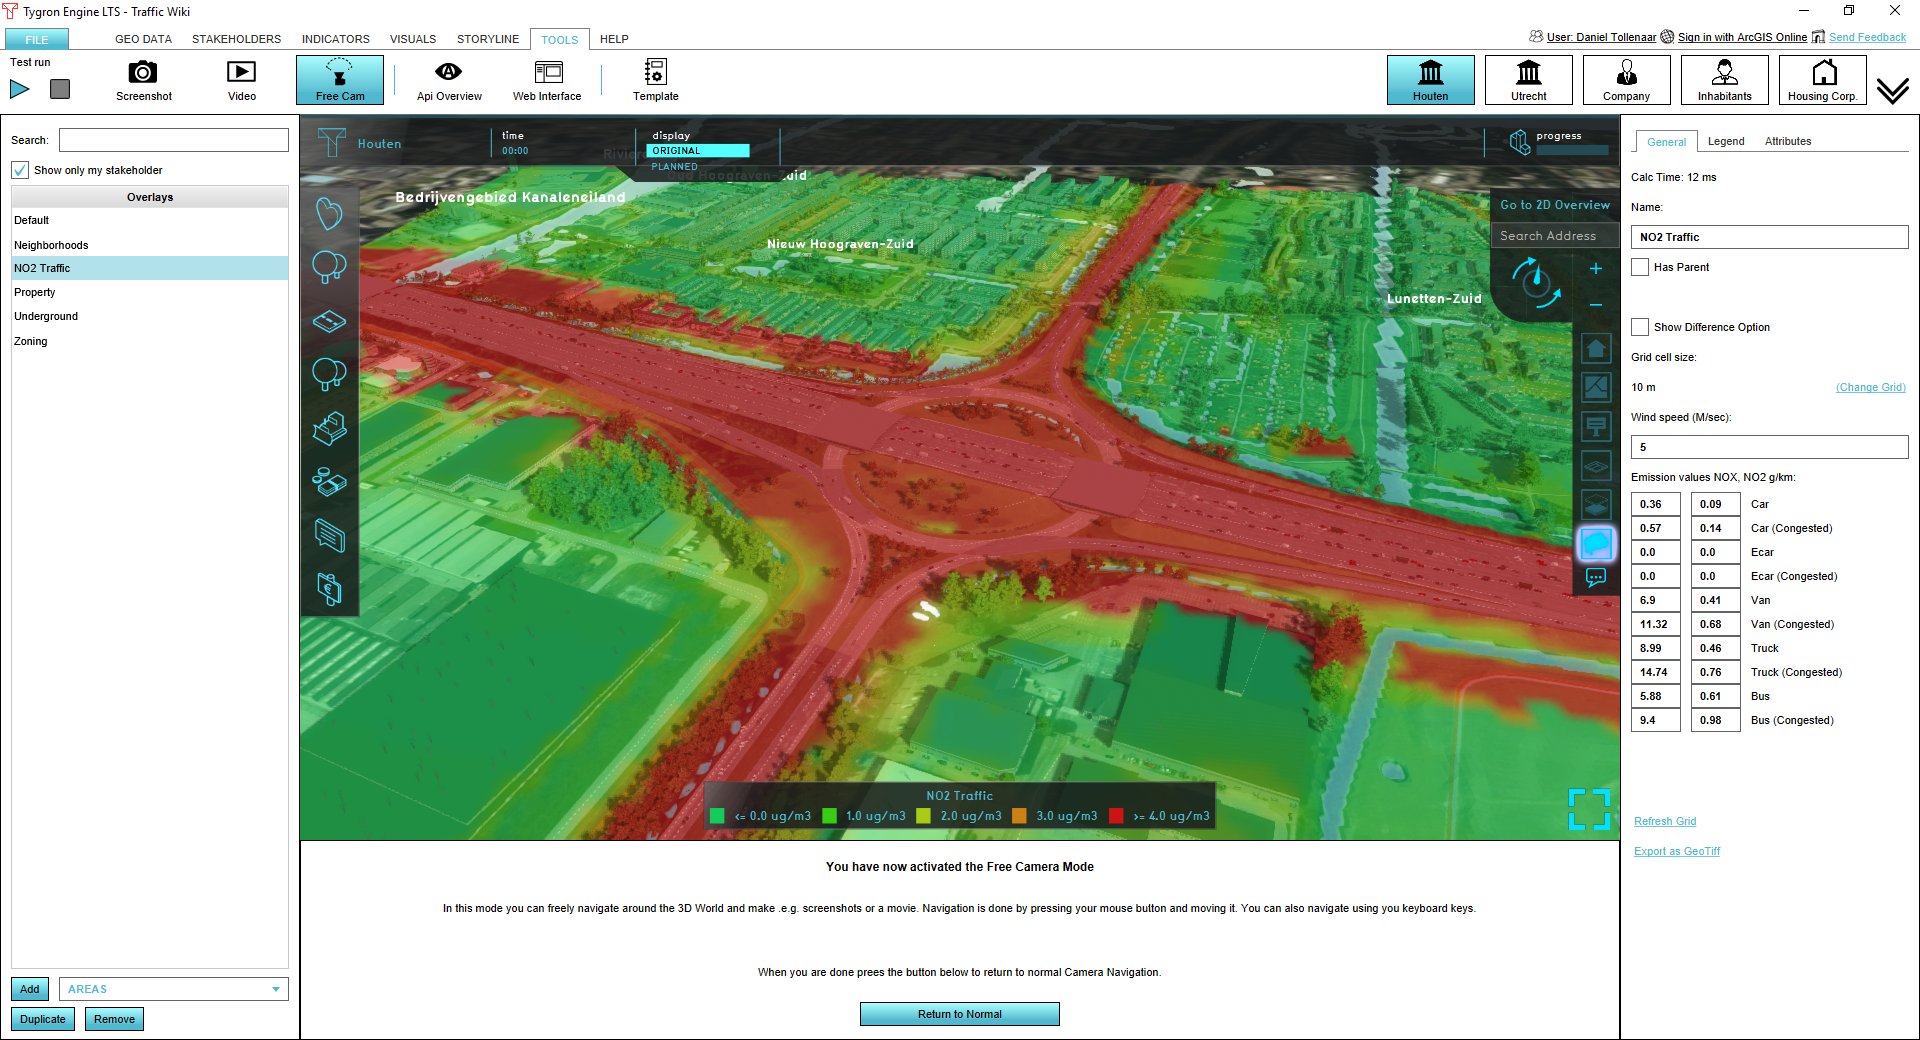
The Traffic NO2 overlay is an Overlay which displays the impact of traffic air polution (in μg/m³ NO2) in different colors for the project area. These colors indicate traffic air polution of a location based on traffic flow and distance.
Adding and removing
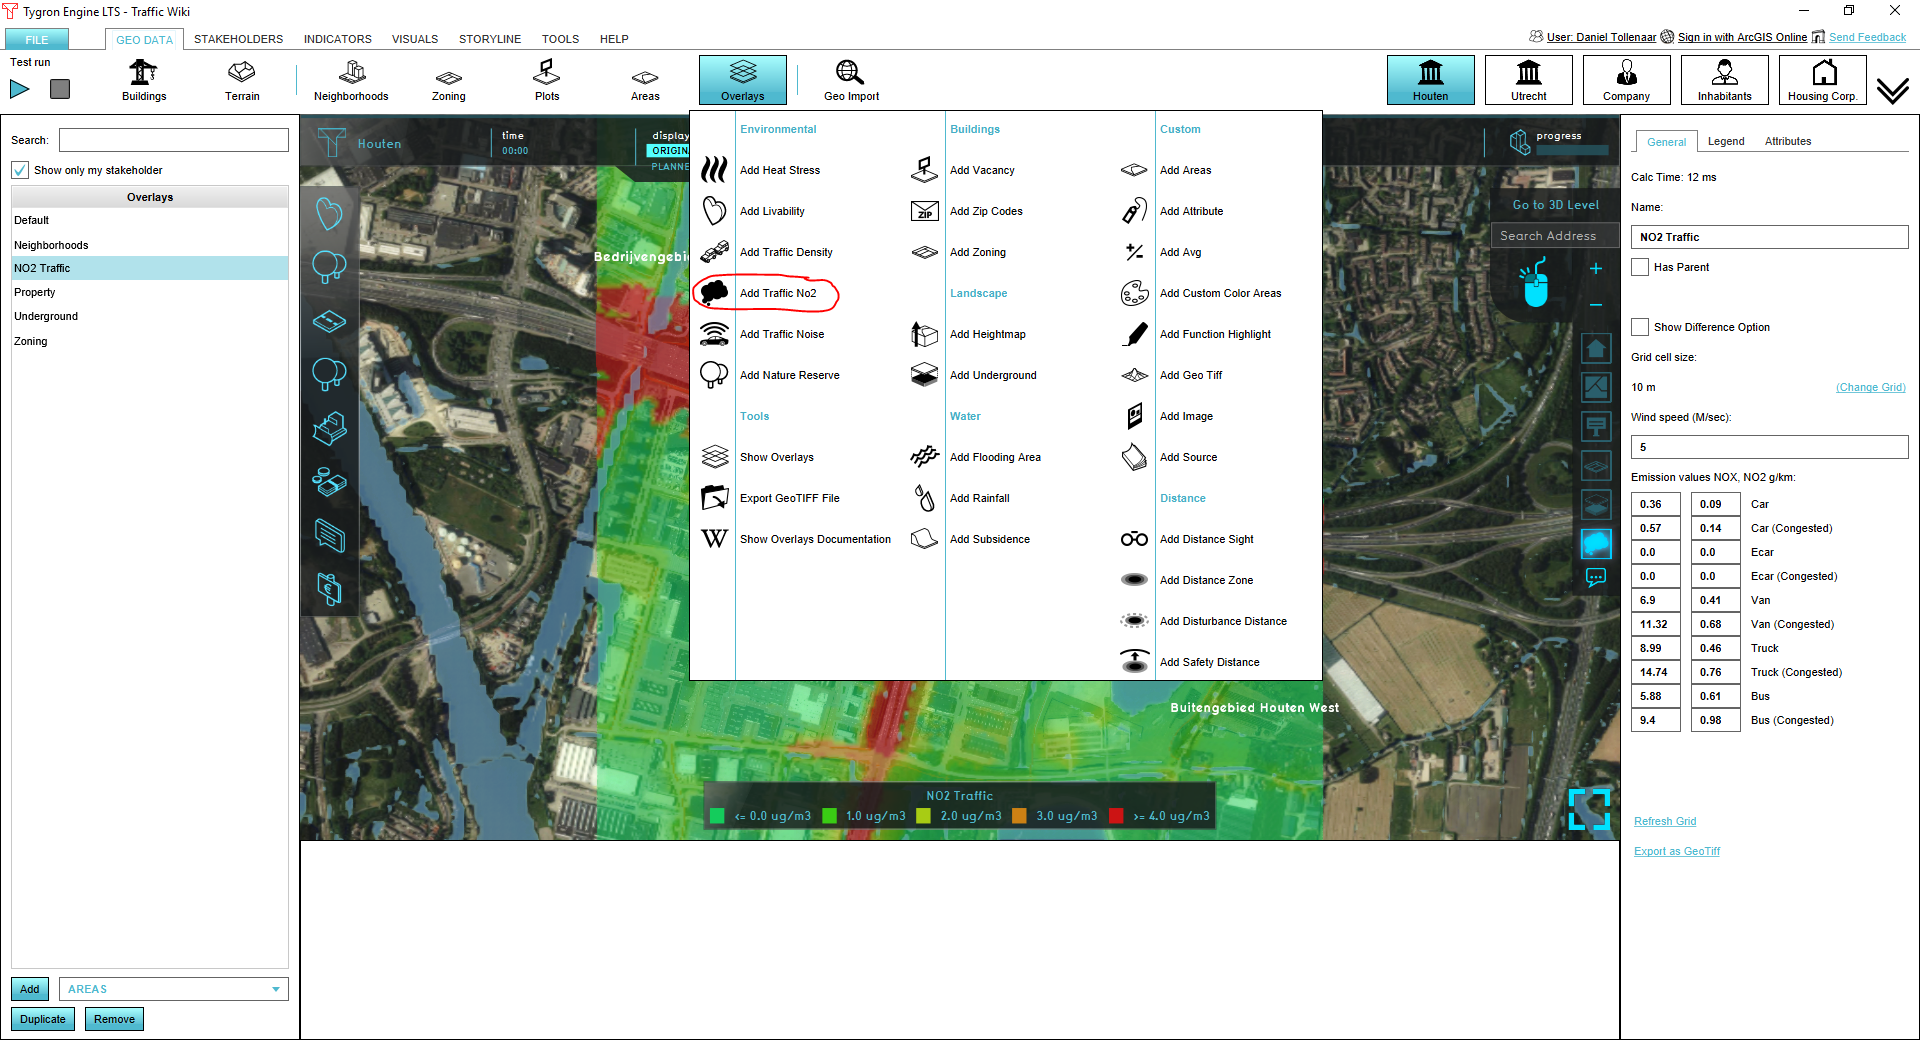
To add a traffic NO2 overlay go to the Overlays menu in the GEO DATA ribbon and select Add Traffic NO2. To remove the overlay, press Remove below the overlays list.
Calculations
The calculations follow the standard rekenmethode 1 (SRM 1), as described on [1]:
Cjm[NO2] = Ca,jm[NO2] + Cb,jm[NO2]
where:
- Cjm[NO2] = annual average concentration [μg/m3]
- Ca,jm[NO2] = annual average background-concentration (default = 0 [μg/m3], can be adjusted via the overlay attributes)
- Cb,jm[NO2] = annual average traffic contribution to NO2 concentration [μg/m3]
To compute the annual average traffic contribution to NO2, Cb,jm[NO2] [μg/m3], the following formula from SRM1 is applied:
Cb,jm[NO2]= fNO2 * Cb,jm[NOx] + (B*Ca,jm[O3]*Cb,jm[NOx]*(1-fNO2))/(Cb,jm[NOx]*(1-Fno2)+K)
where:
- Cb,jm[NOX] = annual average traffic contribution to NOx concentration [μg/m3]
- Cb,jm[O3] = annual average concentration ozon [μg/m3] (default = 42)
- fNO2 = weighted fraction direct emitted NO2 [-]
- B = parameter (default 0.6)
- K = parameter for conversion NO to NO2 (default = 100 μg/m3)
To compute the annual average traffic contribution to NOX, Cb,jm[NOX] [μg/m3], the following formula from SRM1 is applied:
Cb,jm[NOx] = Fk * ENOx * θ * Fb * Fmeteo
where:
- Fk = calibration factor [-] (default = 0.62]
- ENOx = emission number NOx [μg/m/s]
- θ = delution factor [-]
- Fb = tree factor (default = XX)
- Fmeteo = 5/windspeed. Default value for windspeed is 5 m/s
The delution factor, θ, is computed till a distance of 30m with:
θ = a * S^2 + b * S + c
And from 30-60m (for road-type 1 and 4 only):
θ = alpha * S^-0.747
where:
- S is the calculation distance
- a, b, c and alpha are parameters depend on road-type:
The weighted fraction direct emitted NO2 [-] is computed as:
fNO2 = ENO2/ENOx
where:
- ENO2 = emission number NOs [μg/m/s]
The emission numbers (E) for both NOx and NO2 are computed as:
E = N * [(1-FS)*((1-(fm+fz+fb))*El + fm * Em + fz * Ez + fb * Eb) + FS * ((1-(fm + fz + fb)) * El,d + Fm * Em,d + fz * Ez,d+fb*Eb,d)]*1000/(24*3600)
where:
- N = traffic intencity [units per day]
- fm = fraction vans [-]
- fz = fraction trucks [-]
- fb = fraction busses [-]
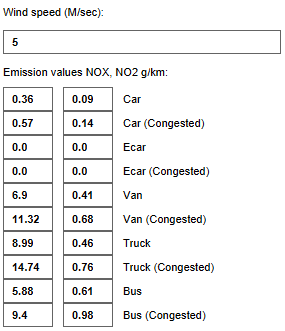
- El = emission value cars [g/km]
- Em = emission value vans [g/km]
- Ez = emission value trucks [g/km]
- Eb = emission value busses [g/km]
- FS = fraction congested traffic [-]
- E*,d = emission factor per class (cars, vans, trucks or busses) if congested
References
The overlay calculations are based on Standard Calculation Method 1 (SRM1) as defined by the dutch government: wetten.overheid.nl


