How to make a line measurement: Difference between revisions
Jump to navigation
Jump to search
(Created page with "{{howto|title=|Select any Grid overlay in the overlay menu.|Select the measuring tool icon (signified by a ruler) in the overlay menu, located between the zoom buttons and...") |
No edit summary |
||
| (2 intermediate revisions by 2 users not shown) | |||
| Line 1: | Line 1: | ||
{{howto|title=|Select any [[Grid overlay]] in the overlay menu.|Select the measuring tool icon (signified by a ruler) in the overlay menu, located between the zoom buttons and the overlay icons.|Select the ''Line Measurement'' option (signified by a line icon) at the top of the measuring tool window.|Click on the location in the [[3D | {{howto|title= | ||
|Select any [[Grid overlay]] in the overlay menu.|Select the measuring tool icon (signified by a ruler) in the overlay menu, located between the zoom buttons and the overlay icons. | |||
|Select the ''Line Measurement'' option (signified by a line icon) at the top of the measuring tool window. | |||
|Click on the location in the [[3D Visualization]] where one end of the measurement line should be placed. | |||
|Click on the location in the [[3D Visualization]] where the other end of the measurement line should be placed. | |||
|The graph in the measuring tool window now displays the values along the placed measurement line.}} | |||
<gallery mode=nolines> | |||
File:Line_measurement.PNG | |||
</gallery> | |||
==Notes== | ==Notes== | ||
| Line 6: | Line 15: | ||
See also | See also | ||
* [[Measuring tool]] | * [[Measuring tool]] | ||
[[Category:How-to's]] | |||
Latest revision as of 15:35, 30 January 2024
How to make a line measurement:
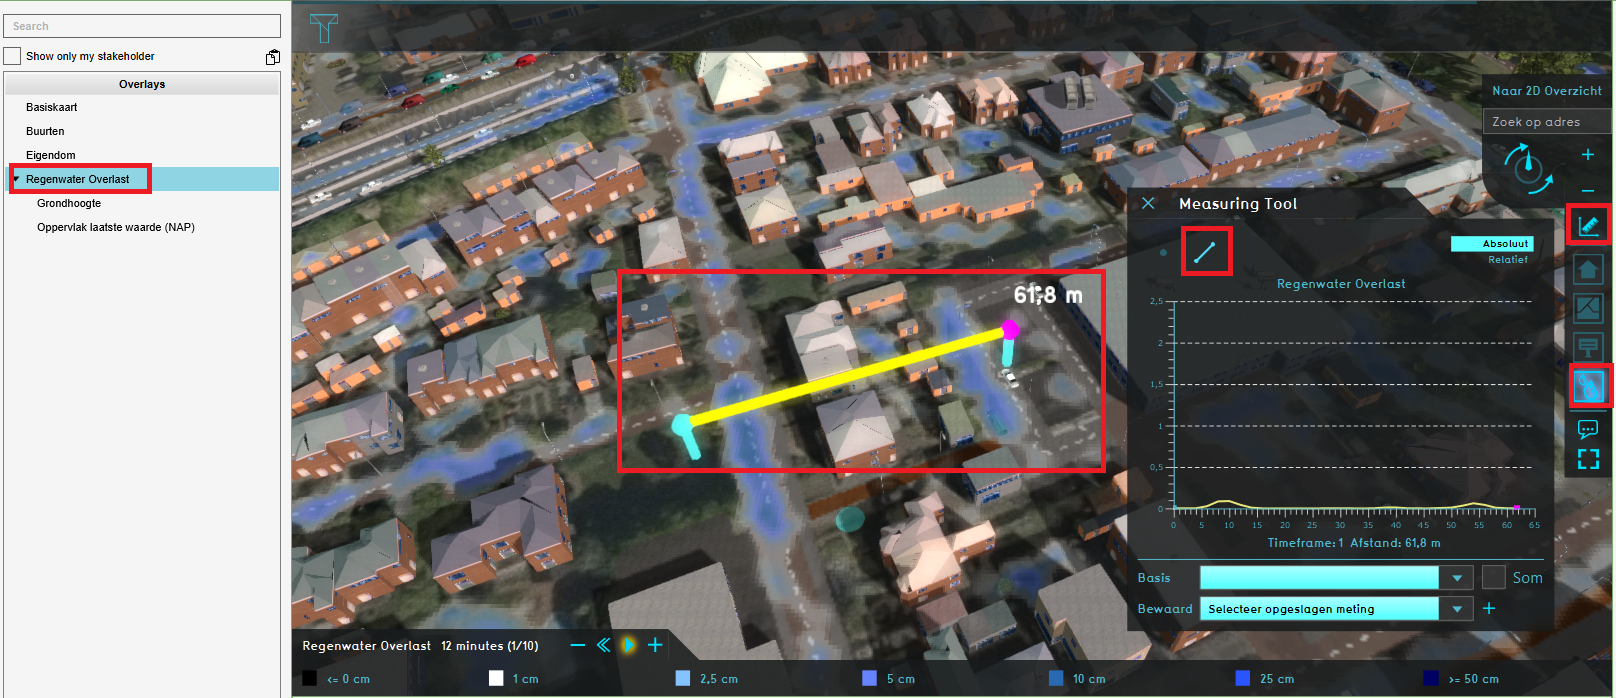
- Select any Grid overlay in the overlay menu.
- Select the measuring tool icon (signified by a ruler) in the overlay menu, located between the zoom buttons and the overlay icons.
- Select the Line Measurement option (signified by a line icon) at the top of the measuring tool window.
- Click on the location in the 3D Visualization where one end of the measurement line should be placed.
- Click on the location in the 3D Visualization where the other end of the measurement line should be placed.
- The graph in the measuring tool window now displays the values along the placed measurement line.
Notes
- Note that when using a line measurement, the displayed values are only the values found along the line at the Timeframes (Water Overlay) currently displayed by the Grid overlay.
See also
