How to configure the Water Overlays: Difference between revisions

From Tygron Support wiki
Jump to navigation Jump to search
mNo edit summary
Line 67: Line 67:
File:Apply_file.JPG
File:Apply_file.JPG
</gallery>
</gallery>
==Import waterdepth data==
For modelling the correct volume of a waterbody, it is important that the depth of a waterbody is accurately modelled. If you have data of your waterbodies and the depth of the soil, for example sections of water bodies, it is possible to import this data as part of the DEM (Digital Elevation Model). Together with importing your water level areas, the volume of the waterbody can then be more accurately calculated. Below the steps on how to import the data.
The steps below assume you have already a digital dataset of your waterdepth data available (no PDF's with sections).
Either a vector dataset of the waterbodies with an attribute value for the depth or a raster dataset is sufficient to use. In this example we use a vector (shapefile) polygon dataset and make use of a GIS (QGIS) to transform the vector data to a raster dataset to import in the {{software}}.
{{Editor steps|title= create the raster dataset
|Open the vector dataset in a GIS.
|Now we want to create the raster by making use of the rasterize menu. This menu can be found in the tab Raster > conversion > rasterize (vector to raster)
|Define in the panel the shapefile, the attribute containing the depth values, the name and location of the output raster and either the raster size or resolution. In this case we recommend to set the resolution. Choose the same resolution as chosen for the [[Terrain_height#Terrain_height_in_the_Tygron_Platform|DEM when generating the project]].
|When these settings have been set, click on the pencil icon to edit the text. It is important to also add a nodata value to create a partial raster. On the places where there is a nodata value, the {{software}} will use the values from the default DEM.  Add the following statement to the text box to create the nodata value: ''-a_nodata <number to replace with nodata>'', for example: ''-a_nodata 0'' (see also the image below). This means that where there is a value of 0 in the vector dataset, it is replaced with a nodata value in the raster dataset.
|Click on OK and wait till the raster data is created. Now you can close the GIS program.
}}
<gallery mode=nolines>
File:Data.JPG
File:Rasterize.JPG
File:Raster_settings.JPG
</gallery>
The next step is to import the created raster to replace the DEM only on the locations of waterbodies with the new raster values.
{{Editor steps|title= import the raster to replace the DEM partially
|(See for more explanation and images on the following steps [[Terrain_height#Import_your_own_DTM|this Wiki page]]). Go to the tab Terrain > Select Elevation Geotiff
|Click on import new Geotiffs in the bottom right corner and choose the created raster. Depending on the file size and the internet speed, it make take some time to upload the file to the server.
|When the file is uploaded, select it and click on Apply
|Refresh the Heightmap overlay and click on the location of a waterbody to check the new height.
}}

Revision as of 09:42, 9 April 2019

Please note: This page is currently being updated.

This page describes several use cases and examples of configurations in different water overlays based on the water module.

Basics

Enhancements

Excessive water

Flooding

These use-cases can be implemented best using the Flooding Overlay.


Rain

These use-cases can be implemented best using the Rainfall Overlay.

Water shortage

These use-cases can be implemented best using the Groundwater Overlay.

Water quality

Stationary analyses

Time-controlled flow rate in a breach area

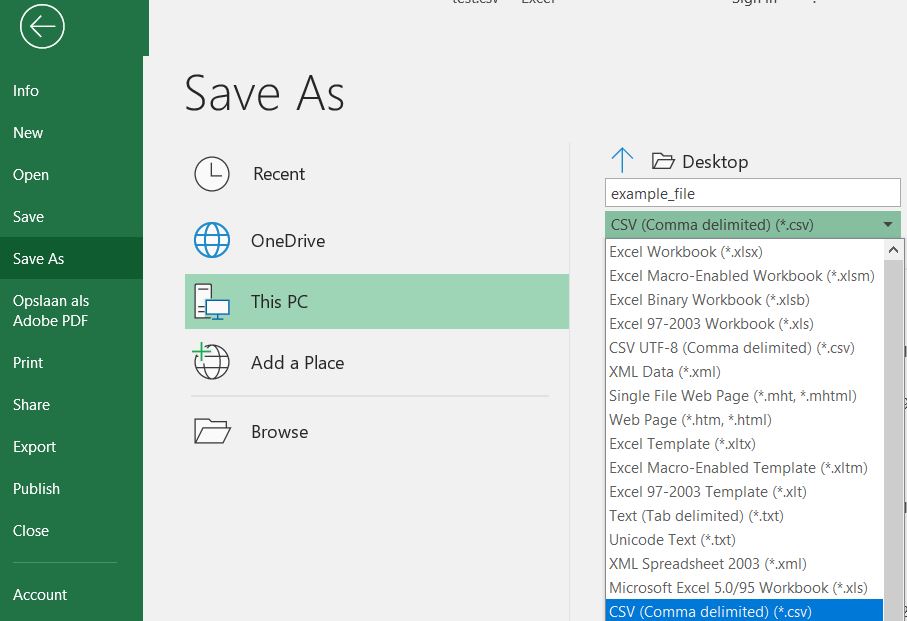
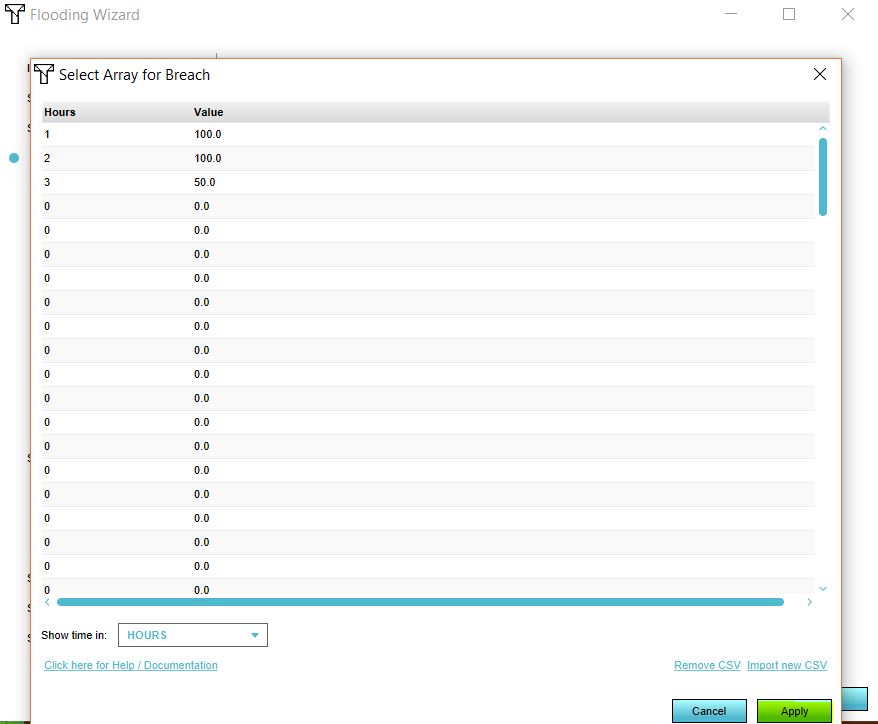
To create a variable Outlet Q in a breach area, a CSV (comma-separated values) file can be imported. Below the steps on how to create such a breach area. For this example we create the CSV in Excel, but you can also use another program to create the CSV.

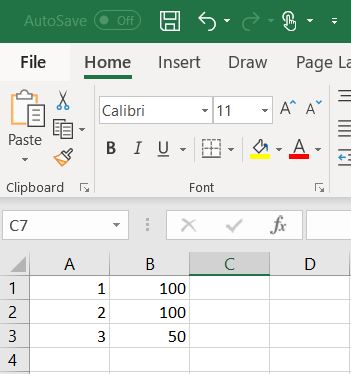
How to set-up your CSV in Excel:
  1. Open Excel.
  2. In the first column, define your time steps. This can be in seconds, minutes, hours or days.
  3. Add the corresponding flow rates per step in the second column.
  4. Save the Excel as a CSV.
How to import the CSV as the flow rate:
  1. Either add a breach area or have your GeoJSON file with your breach area ready. The area should have at least a breach floor attribute.
  2. Add a Flooding Overlay.
  3. Go to the Configuration Wizard of the Flooding Overlay.
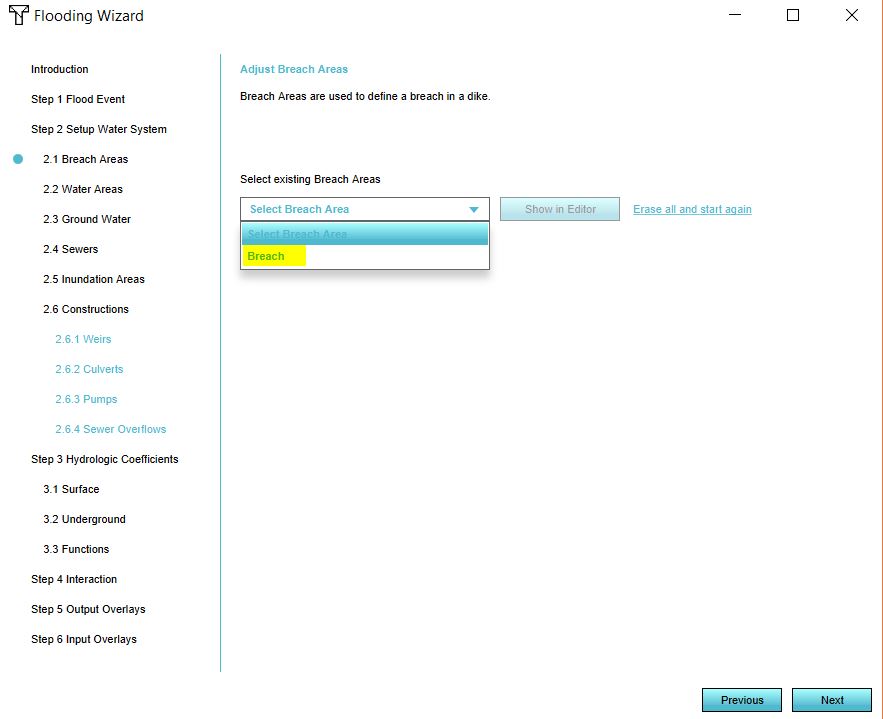
  4. In step 2.1 either select the attribute that specifies your breach floor or import your GeoJSON file.
  5. Click on Next.
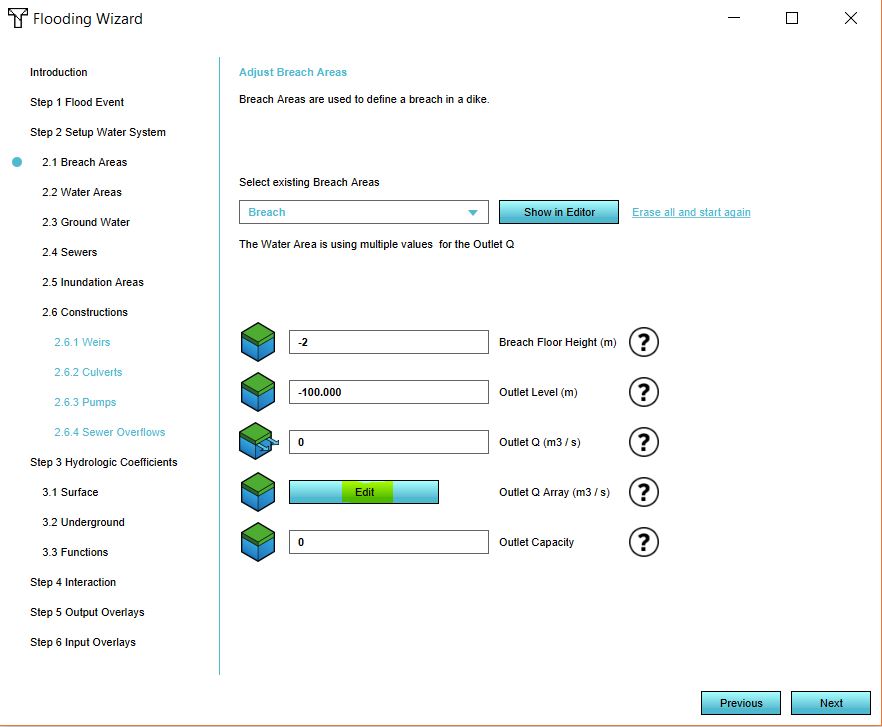
  6. In the dropdown menu, select your breach area. Now click on Edit.
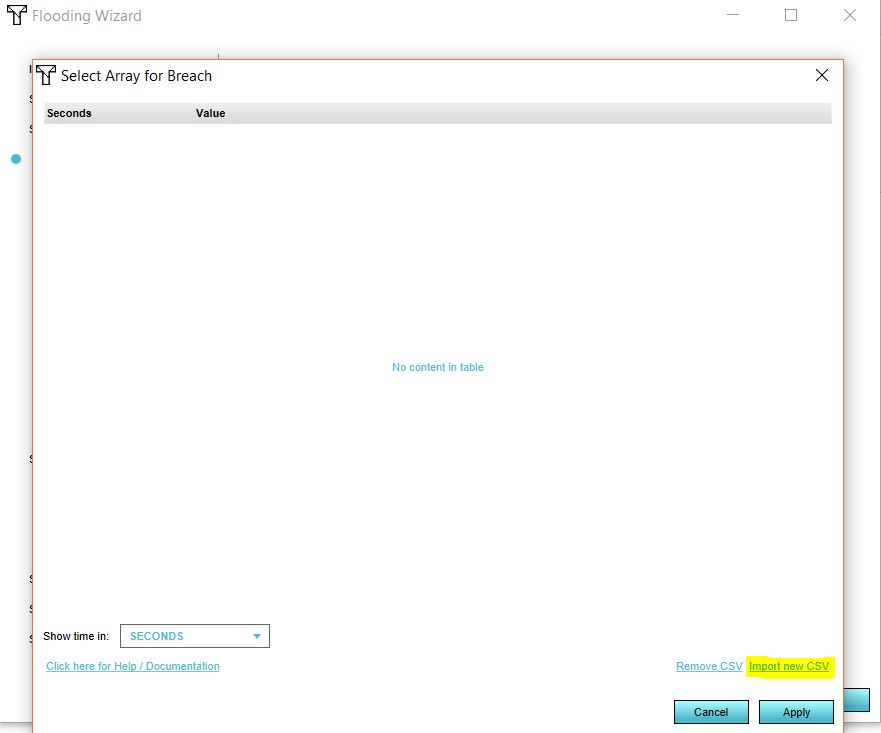
  7. Import your CSV file by selecting the CSV file.
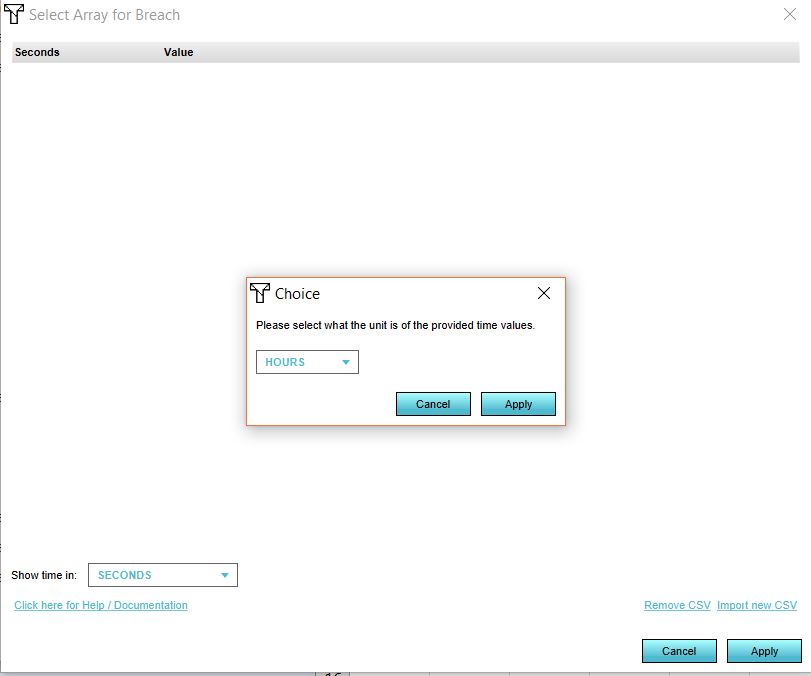
  8. Select the time units in your file.
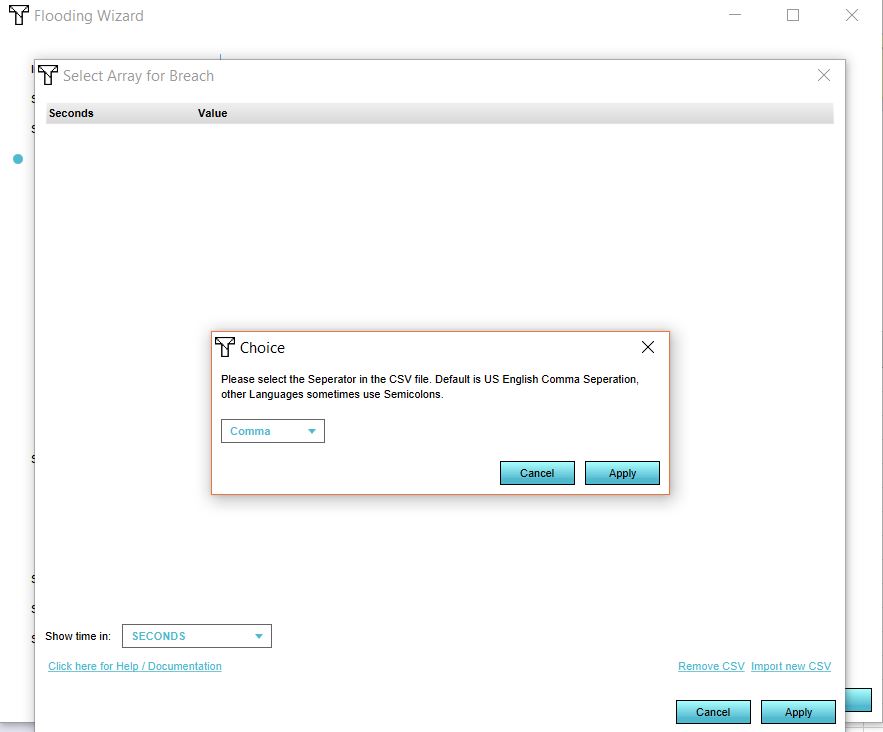
  9. Select the seperator for your file.
  10. Click on Apply.