UK EA benchmark 4 (Water Module): Difference between revisions
| Line 81: | Line 81: | ||
==Results== | ==Results== | ||
===Stats=== | |||
* Software package used: {{software}} | * Software package used: {{software}} | ||
* Numerical scheme: FV (Kurganov, Bollerman, Horvath)* | * Numerical scheme: FV (Kurganov, Bollerman, Horvath)* | ||
* Specification of hardware used to undertake the simulation: | * Specification of hardware used to undertake the simulation: | ||
** Processor: Intel Xeon @2.10GHz x 8 | ** Processor: Intel Xeon @2.10GHz x 8 | ||
** RAM 62.8 | ** RAM (GB): 62.8 | ||
** GPU: 2x NVidia | ** GPU: 2x NVidia 1,080 | ||
** Operating system: Linux 4.13 | ** Operating system: Linux 4.13 | ||
* Time increment used: adaptive | * Time increment used: adaptive | ||
* Grid resolution: 5 | * Grid resolution (m): 5 | ||
* Simulation time: 29 | * Simulation time (s): 29 for 900 timeframes | ||
* | * Object flow (m<sup>3</sup>/s): 283,723.8 | ||
* Remaining volume | * Remaining water volume (m<sup>3</sup>/s): 283,606.9 | ||
===Raster grids (or TIN) at the model resolution | ===Raster grids (or TIN) at the model resolution for water level and flow velocity=== | ||
====Contours==== | ====Contours==== | ||
<ul> | <ul> | ||
Revision as of 14:32, 2 May 2019
This page reports on the performance of the Tygron Platform's Water Module by means of the UK EA Benchmark Test 4 – Speed of flood propagation over an extended floodplain.
The objective of this test is to assess the package’s ability to simulate the celerity of propagation of a flood wave and predict transient velocities and depths at the leading edge of the advancing flood front. It is relevant to fluvial and coastal inundation resulting from breached embankments.[1]
Description
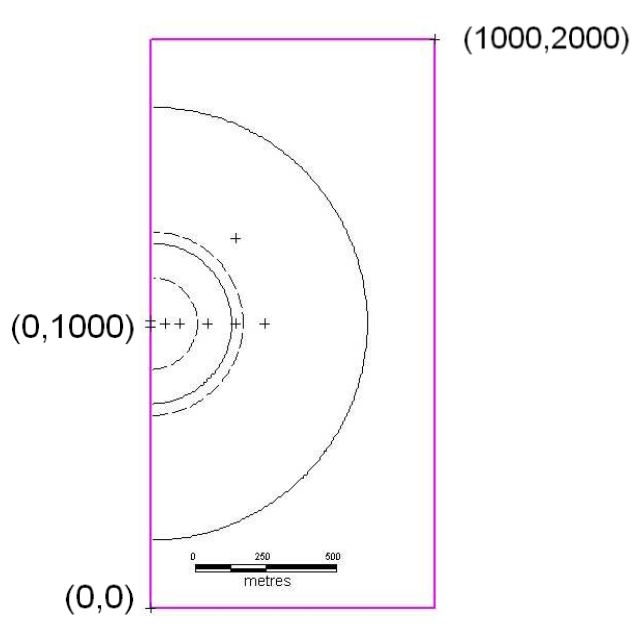
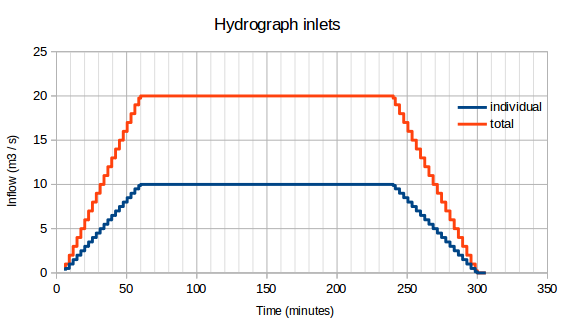
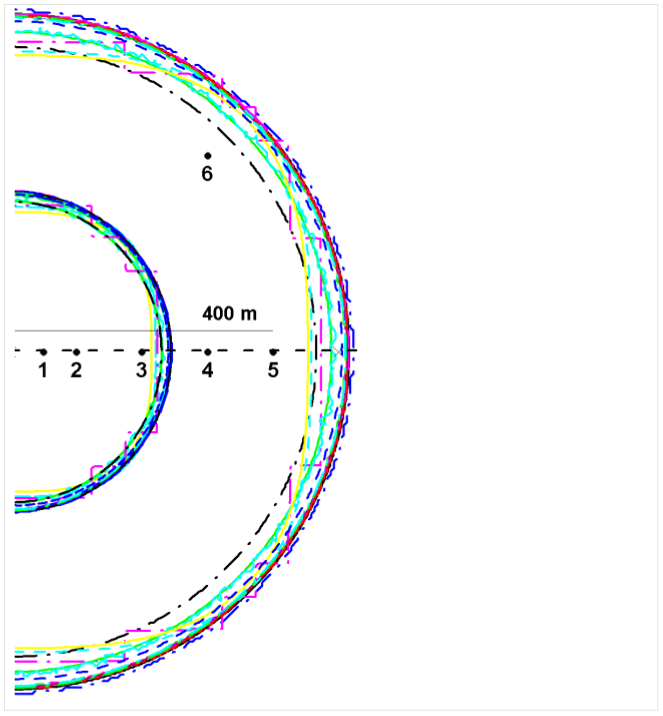
This test is designed to simulate the rate of flood wave propagation over a 1,000 x 2,000 m floodplain following a defence failure (Fig. (a)). The floodplain surface is horizontal, at datum (= 0 m). One inflow boundary condition will be used, simulating the failure of an embankment by breaching or overtopping, with a peak flow of 20 m3/s and time base of ~6 h. The boundary condition is applied along a 20-m line in the middle of the western side of the floodplain.[1]
Boundary and initial condition
- Inflow boundary condition as shown in Fig. (b)
- All other boundaries are closed
- Initial condition: dry bed
Parameter values
- Manning’s n: 0.05 (uniform)
- Model grid resolution (m): 5 (or ~80,000 nodes in the area modelled)
- Simulated time (h): 5
Required output
| Point ID | X | Y |
|---|---|---|
| 1 | 50 | 1,000 |
| 2 | 100 | 1,000 |
| 3 | 200 | 1,000 |
| 4 | 300 | 1,000 |
| 5 | 300 | 1,000 |
| 6 | 300 | 1,300 |
- Software package used: version and numerical scheme
- Specification of hardware used to undertake the simulation: processor type and speed, RAM
- Minimum recommended hardware specification for a simulation of this type
- Time increment used, grid resolution (or number of nodes in area modelled) and total simulation time to specified time of end
- Raster grids (or TIN) at the model resolution consisting of:
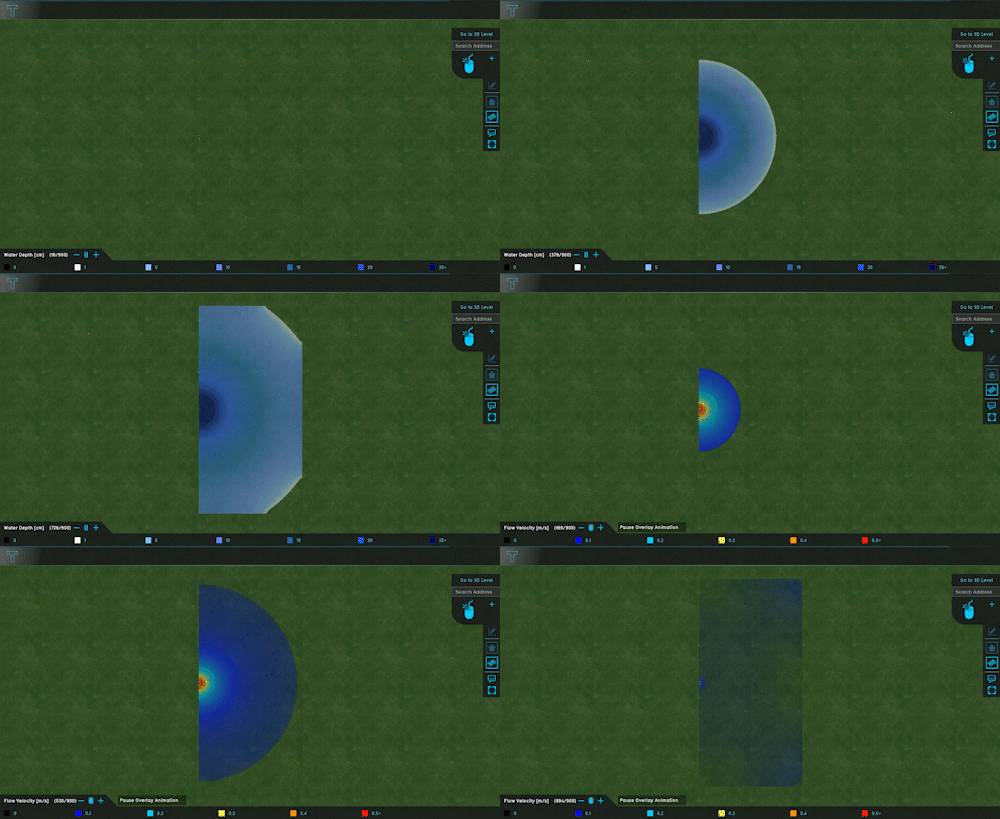
- Depths and at t = 30 min, 1 h, 2 h, 3 h and 4 h
- Velocities (scalar) at t = 30 min, 1 h, 2 h, 3 h and 4 h
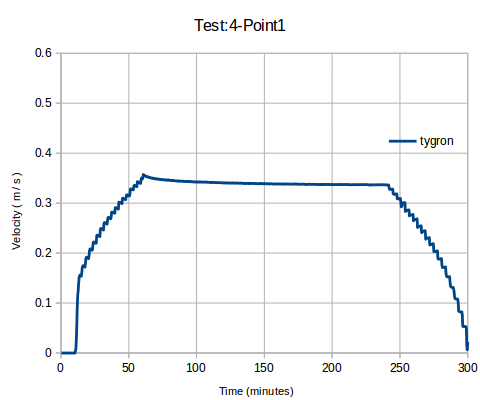
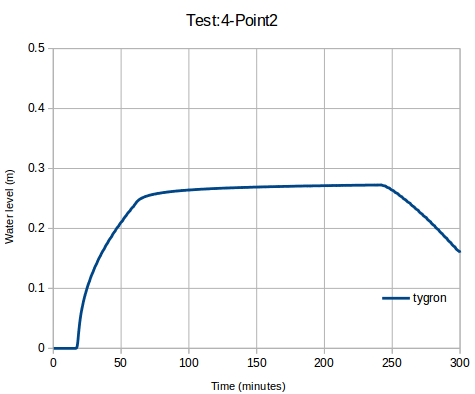
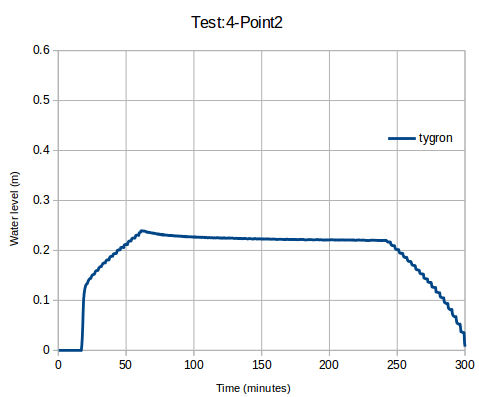
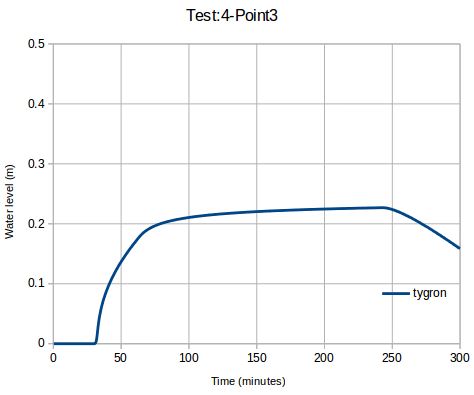
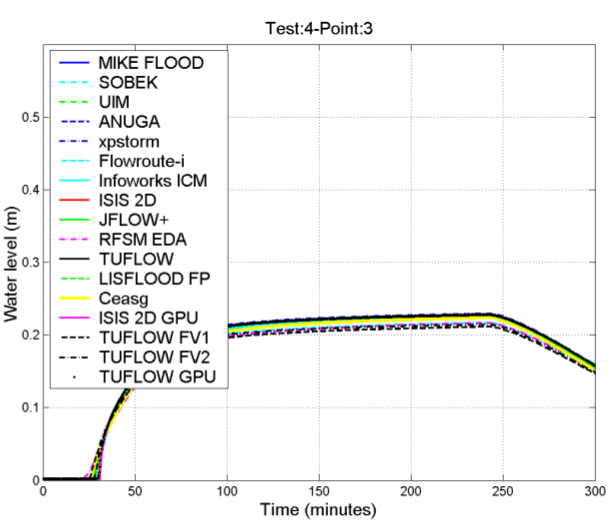
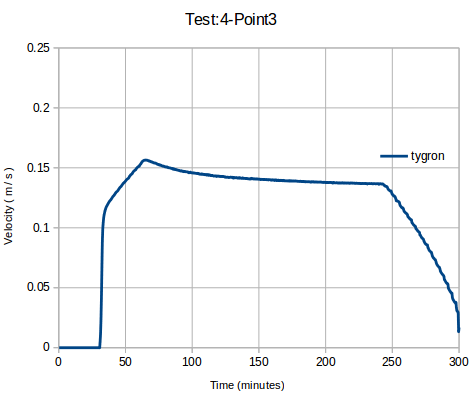
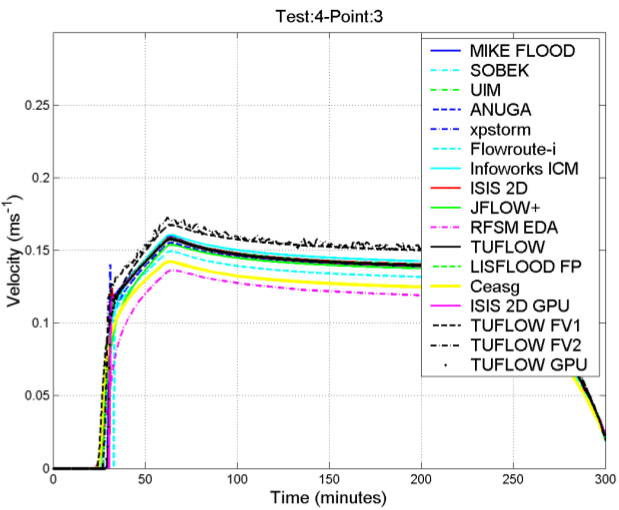
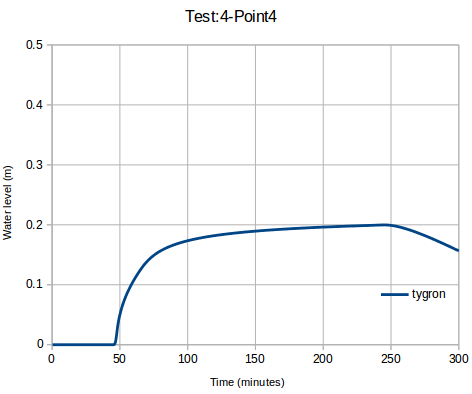
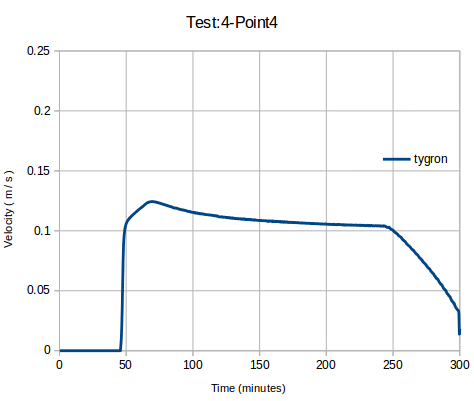
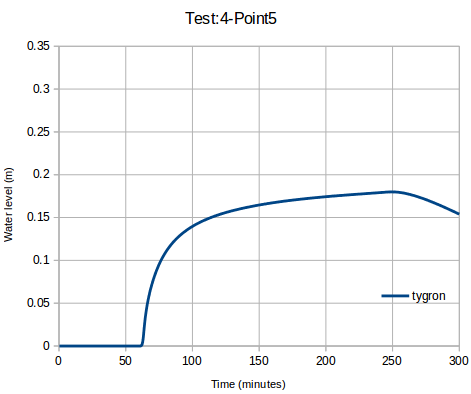
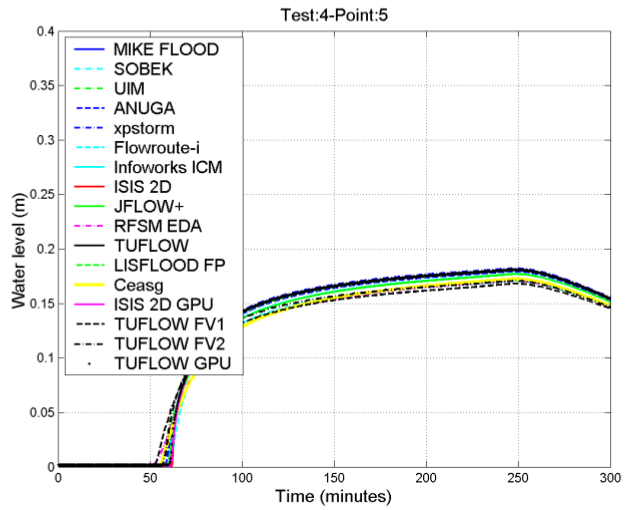
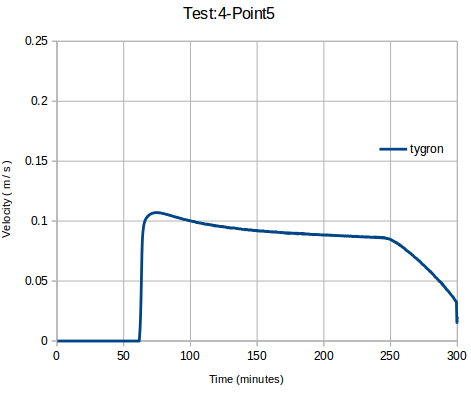
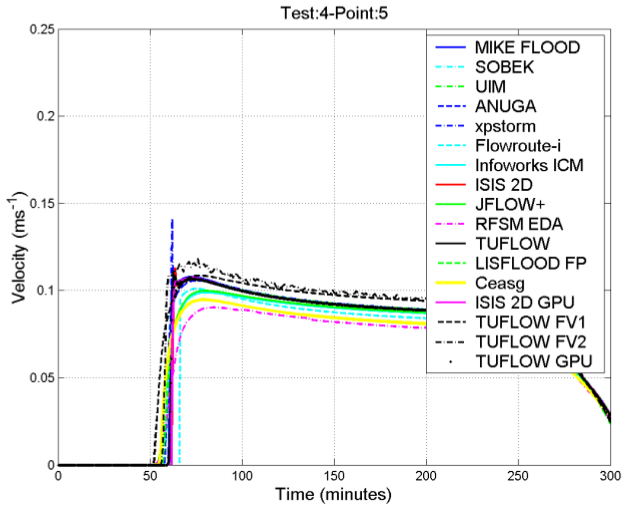
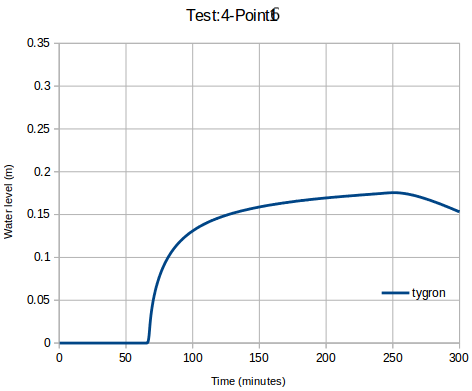
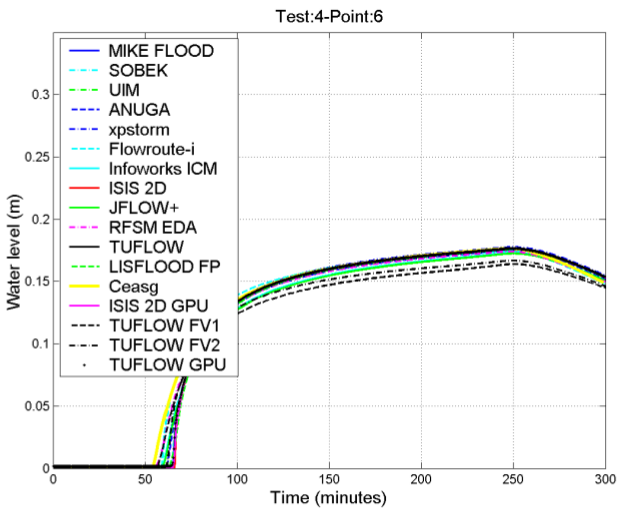
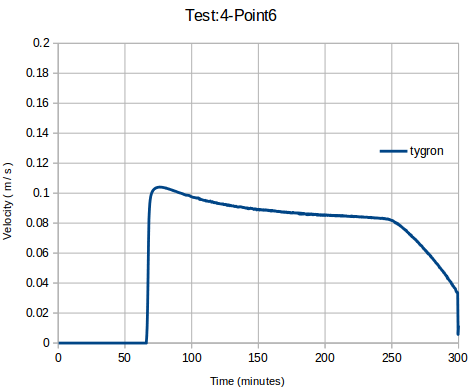
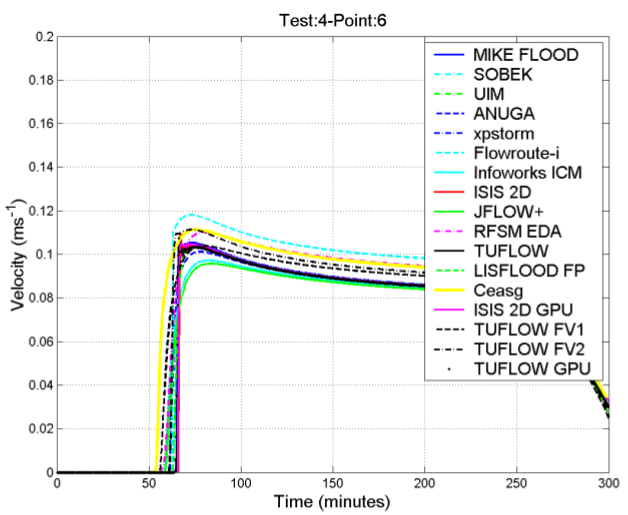
- Plots of velocity and water elevation v. time (suggested output frequency: 20 s) at the 6 locations represented in Fig. (a) and provided as part of dataset
Dataset content
- Upstream boundary condition table (inflow v. time). Filename: Test4BC.csv
- Location of output points. Filename: Test4Output.csv
The model geometry is as specified in Section 2. No DEM is provided, as the surface elevation is level at datum (= 0 m).[1]
Technical setup
- Flat surface
- Grid-cell size (m): 5
- Area size (m): 1,010 x 2,010 (required domain of 1,000 x 2,000 + 5-m border)
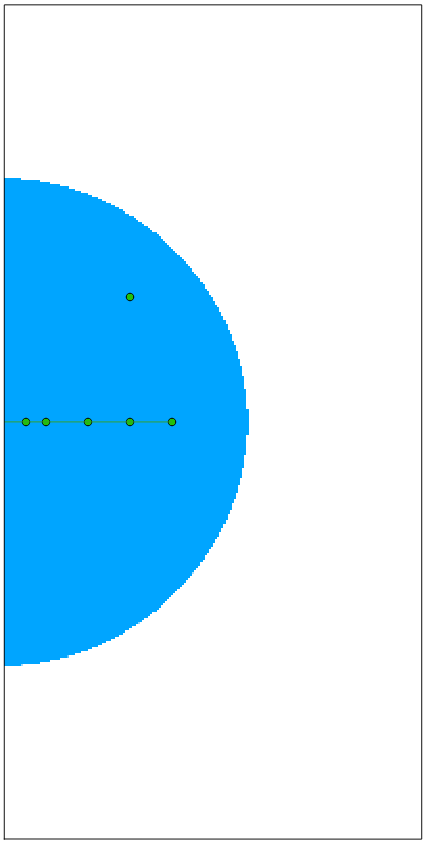
- The measurement points were positioned correctly (see Fig. 1)
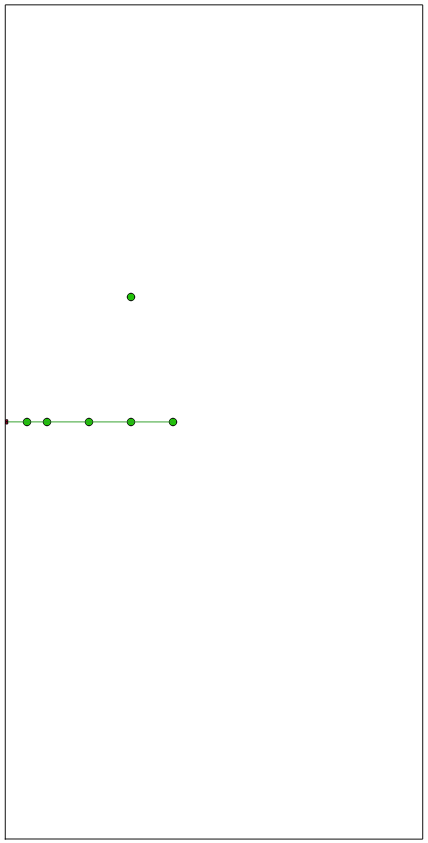
In order to regulate the boundary discharge according the hydrograph (Fig. 2), 2 inlets were implemented. Both inlets occupied one grid cell, one of these located above and the other below the green center line (Fig. 3). The inlets were configured as follows:
- External area (m2): 1,000,000,000
- Water level (m): 1
- Threshold (m): none
- Inlet Q (m):
Results
Stats
- Software package used: Tygron Platform
- Numerical scheme: FV (Kurganov, Bollerman, Horvath)*
- Specification of hardware used to undertake the simulation:
- Processor: Intel Xeon @2.10GHz x 8
- RAM (GB): 62.8
- GPU: 2x NVidia 1,080
- Operating system: Linux 4.13
- Time increment used: adaptive
- Grid resolution (m): 5
- Simulation time (s): 29 for 900 timeframes
- Object flow (m3/s): 283,723.8
- Remaining water volume (m3/s): 283,606.9
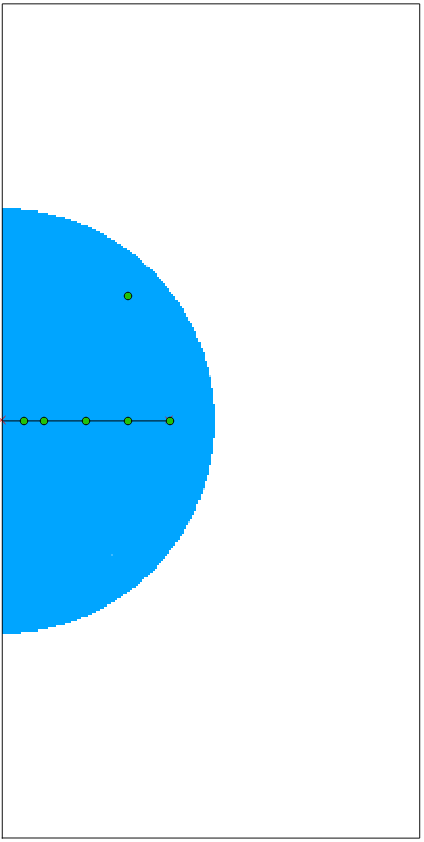
Raster grids (or TIN) at the model resolution for water level and flow velocity
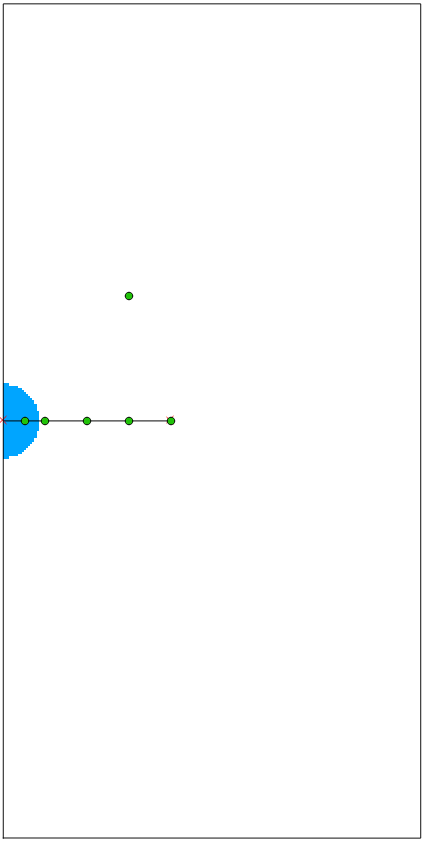
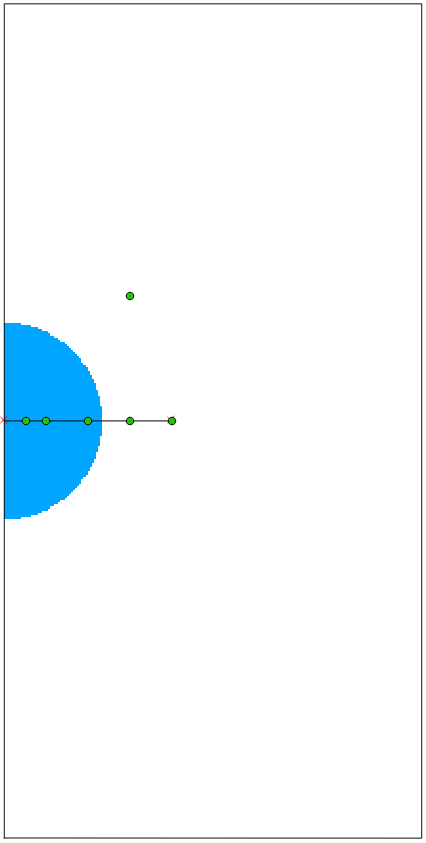
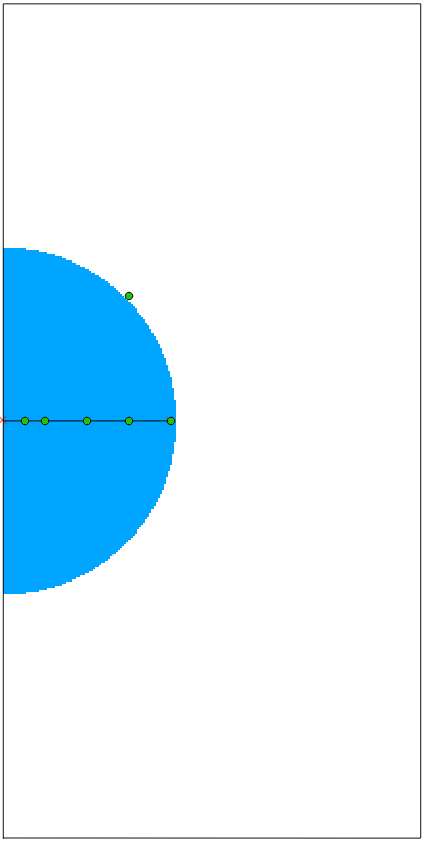
Contours
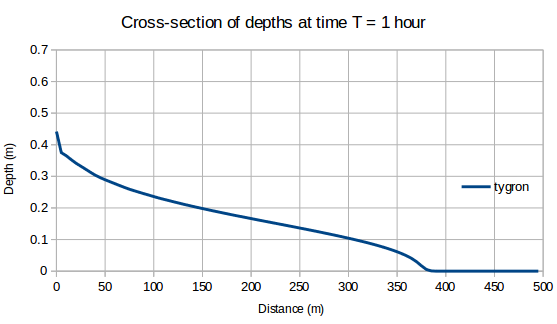
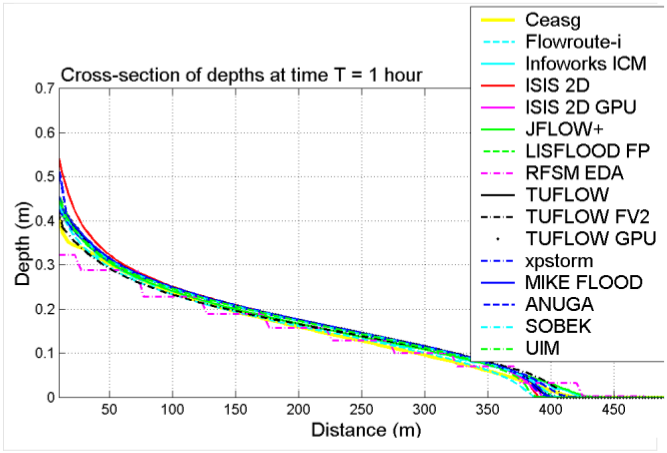
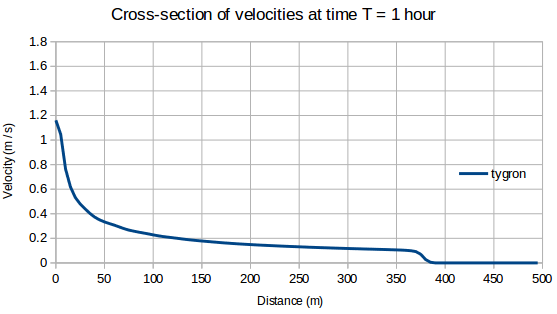
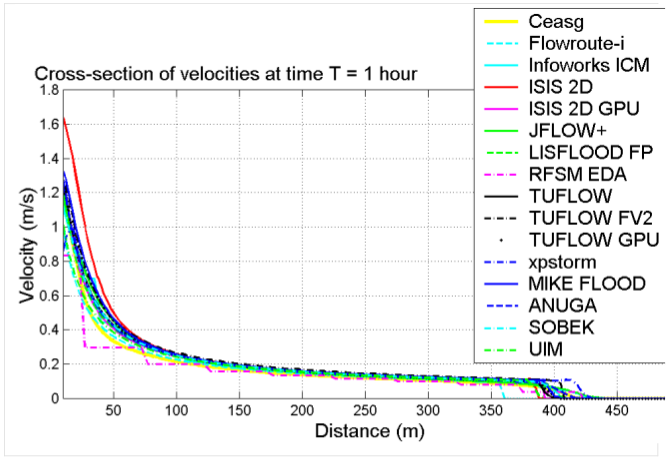
Cross sections
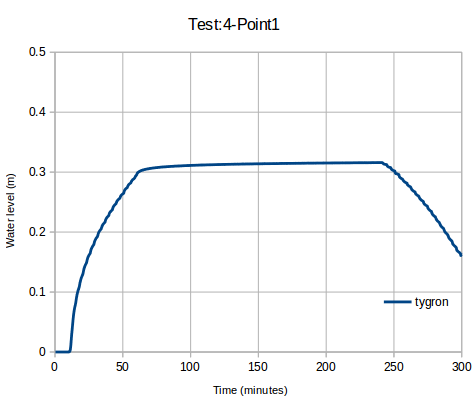
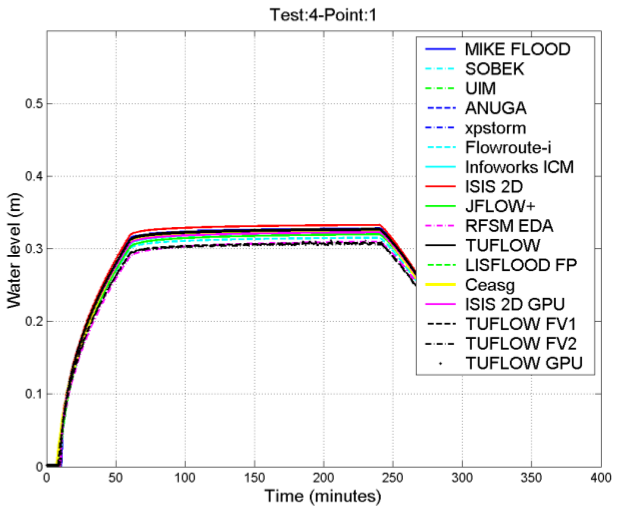
Plots of velocity and water elevation versus time
Notes
- The steps seen in the velocity profile can be related to the definition of the inlet inflow, which is also in steps.
References
- ↑ 1.0 1.1 1.2 Néelz, S., & Pender, G. (2013). Benchmarking the latest generation of 2D hydraulic modelling packages. Report: SC120002. Environment Agency, Horison House, Deanery Road, Bristol, BS1 9AH. ISBN: 978-1-84911-306-9. Retrieved from: https://www.gov.uk/government/publications/benchmarking-the-latest-generation-of-2d-hydraulicflood-modelling-packages
