Traffic NO2 Overlay: Difference between revisions
Jump to navigation
Jump to search
No edit summary |
|||
| Line 19: | Line 19: | ||
Cb,jm = | Cb,jm[NO2] = fno2 * Cb,jm[NOx] + (B*Ca,jm[O3]*Cb,jm[NOx]*(1-fNO2))/(Cb,jm[NOx]*(1-Fno2)+K) | ||
where: | where: | ||
* | * Cb,jm[NO2] = | ||
==References== | ==References== | ||
The overlay calculations are based on Standard Calculation Method 1 (SRM1) as defined by the dutch government: [http://wetten.overheid.nl/BWBR0022817/2013-01-01#Bijlage1 wetten.overheid.nl] | The overlay calculations are based on Standard Calculation Method 1 (SRM1) as defined by the dutch government: [http://wetten.overheid.nl/BWBR0022817/2013-01-01#Bijlage1 wetten.overheid.nl] | ||
Revision as of 12:09, 13 June 2018
What is the Traffic NO2 overlay?
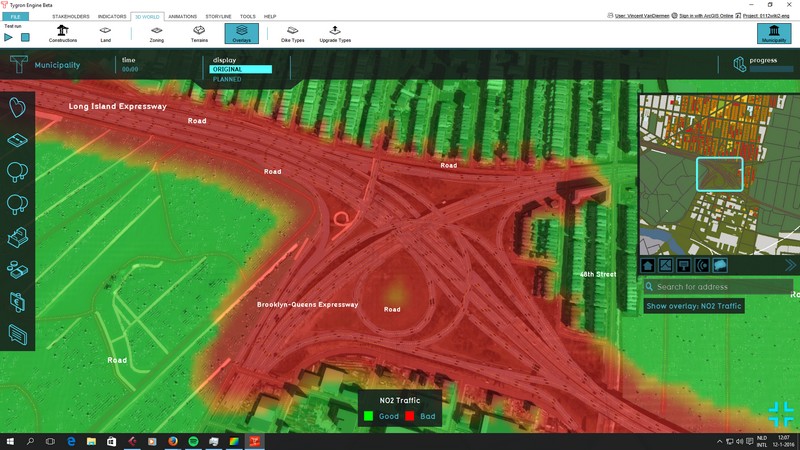
The Traffic NO2 overlay is an Overlay which displays the impact of traffic air polution (in μg/m³ nitrogen dioxide) in different colors for the project area. These colors indicate traffic air polution of a location based on traffic flow and distance.
Traffic NO2 air polution overlay colors
File:Traffic NO2-Overlay Legend.jpg
Traffic NO2 overlay colors
Calculations
The calculations follow the standard rekenmethode 1 (SRM 1), as described on [1]:
Cjm = Ca,jm + Cb,jm
where:
- Cjm = yearly average concentration [μg/m3]
- Ca,jm = yearly average background-concentration (default = 0 [μg/m3], can be adjusted via the overlay attributes)
- Cb,jm = yearly average traffic contribution to NO2 concentration [μg/m3]
Cb,jm[NO2] = fno2 * Cb,jm[NOx] + (B*Ca,jm[O3]*Cb,jm[NOx]*(1-fNO2))/(Cb,jm[NOx]*(1-Fno2)+K)
where:
- Cb,jm[NO2] =
References
The overlay calculations are based on Standard Calculation Method 1 (SRM1) as defined by the dutch government: wetten.overheid.nl
