Subsidence Overlay


Result types
The overlay offers the following result types:
| Result type | Unit | Description |
|---|---|---|
| SUBSIDENCE | m change in land height | The amount that the ground has lowered as a result of subsidence, both oxidation and compaction. A positive number means the ground has lowered. |
| OXIDATION | m change in land height | The amount that the ground has lowered as a result of peat oxidation. |
| SETTLEMENT | m change in land height | The amount that the ground has lowered as a result of compaction. |
| HI_GROUND_WATER | m distance from surface to groundwater | The distance between the ground surface and the highest groundwater level. This number is lower than that of the lowest groundwater level. A positive value means the groundwater is below the surface of the land. A negative value would theoretically mean the groundwater has risen above the surface of the ground. |
| LOW_GROUND_WATER | m distance from surface to groundwater | The distance between the ground surface and the lowest groundwater level. This number is higher than that of the highest groundwater level. A positive value means the groundwater is below the surface of the land. A negative value would theoretically mean the groundwater has risen above the surface of the ground. |
Legend
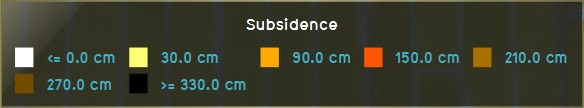
The legend of the subsidence overlays is automatically calculated, based on the amount of years being calculated by the overlay. The colors will remain constant based on average subsidence per year. I.e. if the amount of years is doubled, the values in the legend, corresponding to specific colors, are doubled as well. Because the legend displays total amounts of subsidence rather than averages, the displayed range of amounts changes when the amount of calculation years changes.
The legend of the groundwater overlays is constant, and will display a color from blue through yellow to red to indicate how wet the soil is. The closer the groundwater is to the surface of the land, the bluer the overlay. In contrast to the subsidence legends, the range of values for groundwater do not change.

Subsidence legend for 30 years
Subsidence legend for 60 years
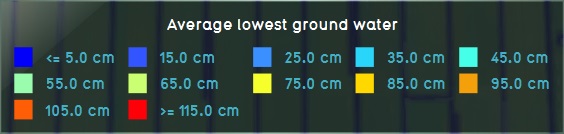
Groundwater legend


Output
The output of all result types of the overlay is in meters. The results can be exported as GeoTiff.
Subsidence output
The output of the grid of each subsidence result type is the subsidence in meters. Depending on the exact result type used, the output is the amount of subsidence as the result of one specific calculation, or the sum of all the calculations of subsidence.
The hover panel will display the following information:
- The amount of subsidence taking place over the configured amount of years.
- The current surface water level, and to what level it will have changed after the subsidence has taken place.
- The indexation policy currently configured for this water level area.
Ground water level output
The output of the grid of each ground water result type is the final distance from the ground water level to the surface of the land in meters.
The hover panel will display the following information:
- The level to which the ground water will have changed, after the subsidence has taken place.
Final water level
The overlay can also write the final surface water level to an attribute of an area. The area where the attribute will be written to is the area which has provided the original water level for the overlay.