Subsidence Overlay: Difference between revisions
No edit summary |
No edit summary |
||
| Line 1: | Line 1: | ||
[[File:Subsidence-Overlay.jpg|thumb|200px|right|The subsidence overlay]] | [[File:Subsidence-Overlay.jpg|thumb|200px|right|The subsidence overlay]] | ||
[[File:Groundwater-Overlay.jpg|thumb|200px|right|The ground water overlay]] | |||
The Subsidence Overlay is an [[Grid overlay|overlay]] that shows which places in the [[3D world]] are subject to subsidence due to oxidation and/or compaction of peat. The [[subsidence calulation|calculations]] can give result about the subsidence, and the effects it has on groundwater levels. To add a subsidence overlay go to Geo Data -> Overlays -> Add Subsidence. | The Subsidence Overlay is an [[Grid overlay|overlay]] that shows which places in the [[3D world]] are subject to subsidence due to oxidation and/or compaction of peat. The [[subsidence calulation|calculations]] can give result about the subsidence, and the effects it has on groundwater levels. To add a subsidence overlay go to Geo Data -> Overlays -> Add Subsidence. | ||
Revision as of 14:20, 26 October 2020


The Subsidence Overlay is an overlay that shows which places in the 3D world are subject to subsidence due to oxidation and/or compaction of peat. The calculations can give result about the subsidence, and the effects it has on groundwater levels. To add a subsidence overlay go to Geo Data -> Overlays -> Add Subsidence.
The Subsidence Overlay can be used to calculate the amount of subsidence which takes place on peat soil, specifically due to peat oxidation and compaction. The calculations are specific for peat soil. Separate formulas for other soil types have not yet been implemented. Although it's possible to use the overlay to give an impression of subsidence resulting from other factors, the results will be less accurate. This means that results have a greater margin of error for different use-cases.
It is possible to add multiple subsidence overlays to a project. By varying their configuration slightly, it is possible to calculate multiple scenario's or time-frames simultaneously.
Result types
The overlay offers the following result types:
| Result type | Unit | Description |
|---|---|---|
| SUBSIDENCE | m change in land height | The amount that the ground has lowered as a result of subsidence, both oxidation and compaction. A positive number means the ground has lowered. |
| OXIDATION | m change in land height | The amount that the ground has lowered as a result of peat oxidation. |
| SETTLEMENT | m change in land height | The amount that the ground has lowered as a result of compaction. |
| HI_GROUND_WATER | m distance from surface to groundwater | The distance between the ground surface and the highest groundwater level. This number is lower than that of the lowest groundwater level. A positive value means the groundwater is below the surface of the land. A negative value would theoretically mean the groundwater has risen above the surface of the ground. |
| LOW_GROUND_WATER | m distance from surface to groundwater | The distance between the ground surface and the lowest groundwater level. This number is higher than that of the highest groundwater level. A positive value means the groundwater is below the surface of the land. A negative value would theoretically mean the groundwater has risen above the surface of the ground. |
Legend
The legend of the subsidence overlays is automatically calculated, based on the amount of years being calculated by the overlay. The colors will remain constant based on average subsidence per year. I.e. if the amount of years is doubled, the values in the legend, corresponding to specific colors, are doubled as well. Because the legend displays total amounts of subsidence rather than averages, the displayed range of amounts changes when the amount of calculation years changes.
The legend of the groundwater overlays is constant, and will display a color from blue through yellow to red to indicate how wet the soil is. The closer the groundwater is to the surface of the land, the bluer the overlay. In contrast to the subsidence legends, the range of values for groundwater do not change.

Subsidence legend for 30 years
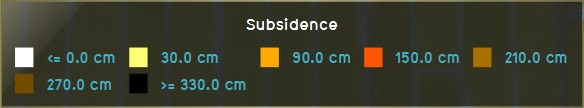
Subsidence legend for 60 years
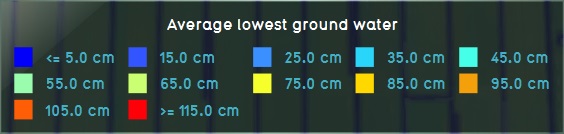
Groundwater legend


How to's


