Results (Water Overlay): Difference between revisions
m (→Timeframes) |
No edit summary |
||
| Line 124: | Line 124: | ||
[[Category:Water Module]] | [[Category:Water Module]] | ||
{{Water Module buttons}} | |||
Revision as of 11:06, 13 June 2019
When a simulation for a particular water overlay by a Water Module is complated, the results are stored as numerical values in a grid spanning the project area. The stored values and their context depend on the selected result type. These grid results are not only stored for the water overlay, but also for its related child result overlays. Additionally, apart from the end result, multiple intermediate timeframes may be generated and stored for each result child overlays.
To find out what possible result types the water overlay has, see list of possible result types of the water overlay.
However, the Water Module provides more output for the water overlay to gain further insight into the performed simulation, to verify and visualize it. The following topics are described in this page:
Visualize results
The most common method of analyzing the results of the calculation is by performing a simple visual inspection of the values of the grid. A basic visual overview along with the ability to select a specific location for further information can suffice for most initial result analysis.
Overlay Visualization
The results of the calculation are visualized when the overlay is selected, based on the colors configured for the overlay's legend. Each location in the 3D world is displayed using a color either matching a value as configured in the legend, or an interpolation of colors between the colors of two values. This means a grid of numerical values, which would be difficult to inspect at a glance, can instead be viewed intuitively.
Timeframes
- Main article: Timeframe
The water overlay can be configured to store multiple timeframes of results. Each timeframe is a complete snapshot of results of the entire project area. These results can be viewed in sequence for an intuitive overview of the progression of the simulation. By clicking on the "play" button in the legend in the session interface, an animation is started which displays the timeframes in sequence.
Note that the simulation time is divided into a TIMEFRAMES amount of periods, and at the end of each period a timeframe is recorded. This means the first timeframe is not a snapshot of the initial state of the simulation, but a snapshow of the state of the simulation after the first period of time has passed already.
System visualization
Depending on whether the option is selected, the hydrological system can be visualized when when the overlay is activated. Each water level area will be visualized by a blue floating sphere and a striped border along the surface of the terrain. Sewer areas are visualized by an orange floating sphere. If the sewer has a sewer overflow, the overflow is connected to the sewer's sphere via an orange line. Culverts, weirs, and pumps are visualized by green, orange, and red spheres respectively for their endpoints, connected by blue lines.
If water has flowed through any of the hydrological constructions, animated arrows in the connecting lines will indicate that movement.
Weather visualization
When a water overlay exists in a project, and the animation of a weather is triggered (either manually or automatically), the animation of the weather will include a visualization of the water as it progresses during the simulation.
During the weather animation, panels which make use of the VISIBLE_TIMEFRAME attribute will appear only from the specified timeframe.
In a setup where only a single water overlay refers to a weather effect, when that weather effect is triggered that water overlay's simulation is animated. When multiple water overlays or no water overlay refer to a weather effect, the behavior for visualization is not consistently defined, and a water overlay will be semi-randomly selected for visualization.
Inspecting results
After a first visual inspection of the output, there are several means of gaining a more detailed insight into the results. Several built-in tools allow for a more intuitive way of reading and comparing results, while there are also means available to use the results for further programmatic analyses.
Hover panel
When the overlay is selected, it's possible to click anywhere in the 3D world to open the hover panel. This panel shows some information about the clicked location. The following information is displayed by the hover panel:
- The ground height, which is the terrain height relative to datum.
- The output value of the overlay, which is dependent on the selected result type.
- The hydrological properties of the terrain (if applicable), such as manning value and infiltration speed.
- The hydrological properties of features (if applicable), such as water level, inundation level, and altered terrain height.
- The hydrological properties of constructions (if applicable), such as building storage, and sewer storage of sewered buildings.
Measuring tool
- Main article: Measuring tool
While viewing the overlay, a general impression of the values can be seen at a glance. However, depending on the configuration of the overlay's legend the exact values may be difficult to view exactly. Using the measuring tool it's possible to retrieve the values of the overlay on exact locations. Additionally, cross-sections can be defined and easily have their values inspected.
Water balance
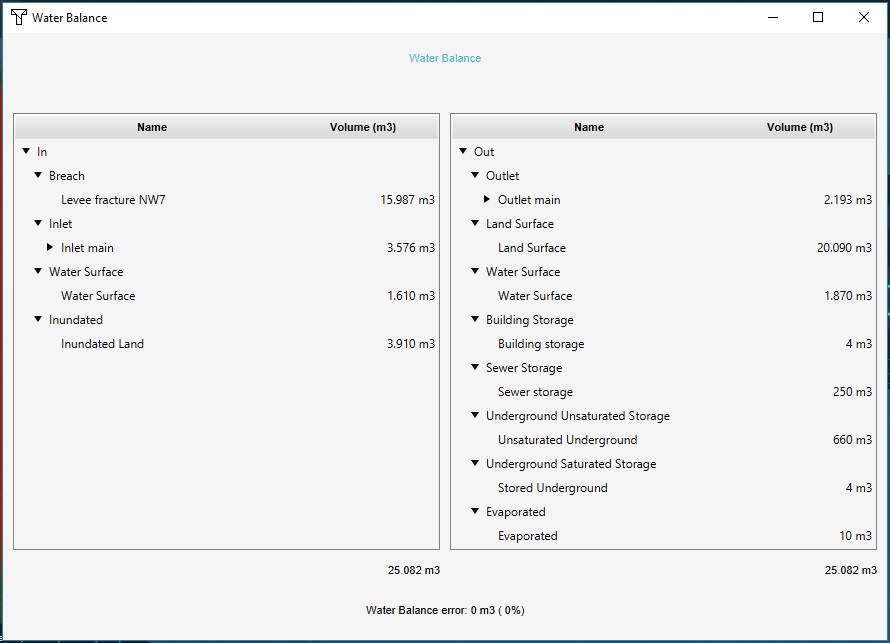
During the simulation, a tally is kept of the total amount of water which the hydrological model is initialized with, how much flows in and out, and how much is left in various layers when the simulation completes. The overview of these tallies is known as the water balance, and can be accessed after the calculation has completed. It will display water categorized into input (where it was initialized and/or how it entered the hydrological system) and output (where in the hydrological system it ended up, or through which path or process it left the hydrological system).
The following entries are displayed:
| Input | Output |
|---|---|
|
|
For completeness, a total for both water input and output is displayed, as well as a check on any eventual water loss in the system. Depending on the size of the project area and the amount of water flowing through various cells, there may be a minor difference between the input and output due to numerical rounding. In these cases the difference should amount to less than a tenth of a millimeter of water per cell in the calculation.
Debug info
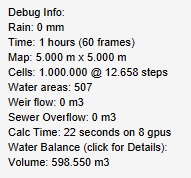
After the calculation completes, some additional information is tallied and output for debugging purposes. This is intended for verification that the model has computed as expected, and may provide some basic information at a glance. It is not meant as a primary tool for in-depth analysis of the results.
The following information is displayed:
| Debug info |
|---|
|
Input overlay
- Main article: Average Overlay
The water overlay's calculations rely on multiple geographical parameters, such as manning values and evaporation factors. To help with both understanding the outcome of the calculation as well as verifying the results, the configuration wizard offers the option to add input overlays to the project, which are Average Overlays configured to display the input parameters geographically.
Overlays such as these can also be created manually, by creating an Average Overlay and configuring it such that it functions on the desired attribute, and with an as small an averaging distance as possible. Optionally, a specific layer (such as constructions or terrains) can be configured which the overlay should inspect.
TQL
- Main article: TQL
The overlay's data can be computationally retrieved using TQL. This allows the results of the overlay to be summarized, and to be used in the calculations of excels for the use in indicators or panels.
Storing results
A number of output forms don't fit in the analysis structure described above, but can provide additional information or insight into the calculation. These can provide different ways of looking at both the input and output of the simulation. They are offered as a means to further visualize but also verify the performed calculations.
Exporting Geotiff
- Main article: Grid overlay
The 3D client offers sufficient ways to visually inspect the water overlay's results for general overview, but use-cases exist in which post-calculation analysis in external tools is desirable. For these situations it is possible to export the results of the calculation in the form of a GeoTIFF. The resulting file can be opened in other GIS software.
Storing specific overlay result
- Main article: Grid overlay
When a water overlay has completed a complex calculation, it may be interesting to save the results as an inactive copy. This will create a duplicate overlay configured exactly the same way as the original, but set to be inactive. This will allow the current results to be kept available as a separate overlay without additional computational overhead, and for the original overlay to be used for further calculations of other scenario's.


