Indicator Tutorial (Solar Panels): Difference between revisions
Jump to navigation
Jump to search
(Created page with "This tutorial guides you through the steps that are necessary to build your own simple Indicator using excel. In this example, an Indicator is build that calcula...") |
No edit summary |
||
| (30 intermediate revisions by 4 users not shown) | |||
| Line 1: | Line 1: | ||
{{tutorial prerequisites | |||
| required-excel=yes | |||
}} | |||
==Creating an indicator for solar panels== | |||
This tutorial guides you through the steps that are necessary to build your own simple [[Indicator]] using [[Excel]] and [[TQL]]. In this example, an Indicator is build that calculates the amount of (different kinds of) houses with solar panels that are present in a neighborhood. | |||
An example of an Indicator that was build following these steps can be found in the [[ | You can use this tutorial in several ways: | ||
* To practice building your own Indicator from scratch. Please note that for this, a good level of experience with working with Excel is required. | |||
* To learn of what elements an Indicator consists, and to be able to adjust excisting Indicators to your own wishes. For this, do not only start with downloading the dummy Indicator (step 1 underneath), but also download the example Indicator in the Public [[GeoShare]] named 'Houses with Solar Panels' straigt away, and compare both for each step. | |||
{{Editor steps|title=create an 'Amount of Houses with Solar Panels' Indicator | |||
|Download the 'Dummy Indicator' from the [https://www.tygron.com/en/2019/05/22/tql-and-indicators/ Video Tutorial page]. Use this as a starting point for your own Indicator. | |||
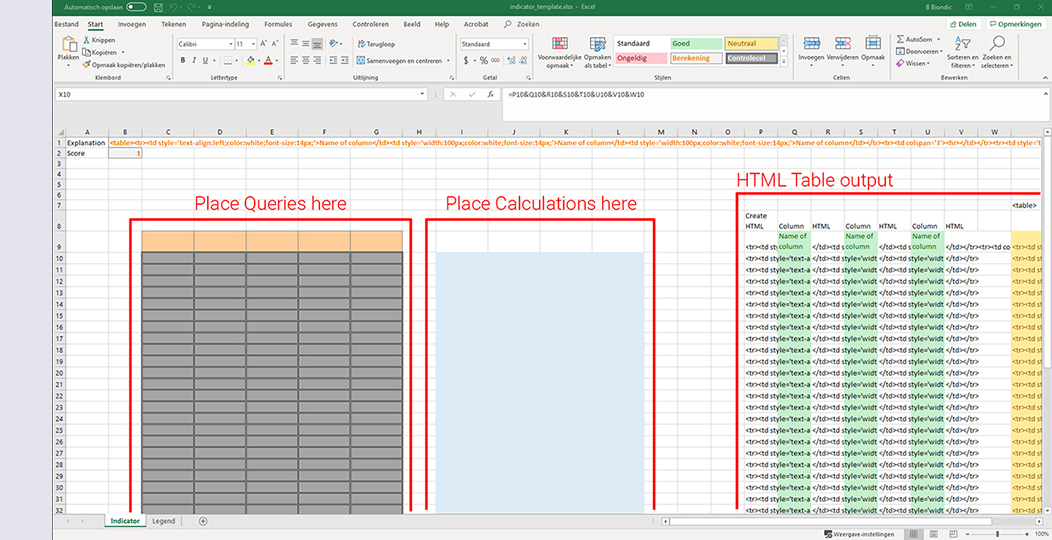
|Explore the Dummy Indicator. Note that the grey area in the Dummy Indicator is meant for requesting information from the Tygron Platform using queries (TQL). The light blue area is meant for calculations - for instance adding and subtracting data from the Platform. The area on the far right is the html table meant for presenting the results. | |||
|Check which (housing) [[Functions|Functions]] with solar panels are present in the {{software}}. | |||
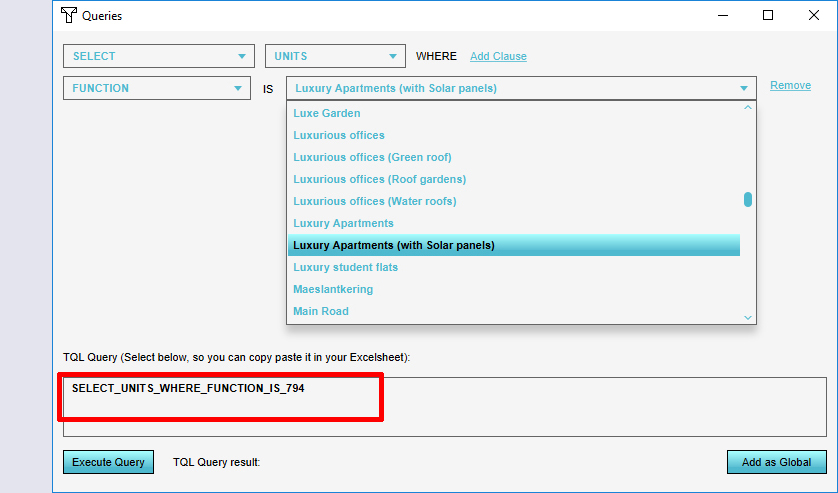
|Compose the right [[TQL|TQL]] queries necessary tot determine the amount of housing functions with solar panels per neighbourhood. Note that you need information about which neighbourhoods are present and how many (differtent kinds of) houses are present in both the Current and the Maquette state. | |||
|Determine and Fill in the required calculations in your Excel Indicator. For instance, the increased amount of buildings with solar panels is obtained by subtracting the amount in the Current state from the amount in the Maquette. | |||
|Think of how you want to show the results in the table in the Indicator panel and fill in the [[HTML|html]] table according to this. | |||
|[[Indicators#Editing Indicators|Add the Indicator]] to your project and test it. | |||
|Optional: upgrade your Indicator. Add a column with the resources provided with the Solar Panels. Make an assumption for the resources per house with Solar Panels. | |||
}} | |||
{{gallery | |||
| Excel_voorbeeld.jpg | Excel example | |||
| TQL.jpg |TQL | |||
}} | |||
{{article end | |||
| notes= | |||
* An example of an Indicator that was build following these steps can be found in the Public [[GeoShare]] named 'Solar panels indicator'. | |||
| external= | |||
* http://www.tygron.com/en/2018/08/28/indicators/ How to implement Indicators in the {{software}} | |||
}} | |||
Latest revision as of 10:15, 3 February 2023
Prerequisites
The following prerequisites should be met before starting this tutorial:
- Microsoft Excel is required for completing this tutorial.
Creating an indicator for solar panels
This tutorial guides you through the steps that are necessary to build your own simple Indicator using Excel and TQL. In this example, an Indicator is build that calculates the amount of (different kinds of) houses with solar panels that are present in a neighborhood.
You can use this tutorial in several ways:
- To practice building your own Indicator from scratch. Please note that for this, a good level of experience with working with Excel is required.
- To learn of what elements an Indicator consists, and to be able to adjust excisting Indicators to your own wishes. For this, do not only start with downloading the dummy Indicator (step 1 underneath), but also download the example Indicator in the Public GeoShare named 'Houses with Solar Panels' straigt away, and compare both for each step.
How to create an 'Amount of Houses with Solar Panels' Indicator:
- Download the 'Dummy Indicator' from the Video Tutorial page. Use this as a starting point for your own Indicator.
- Explore the Dummy Indicator. Note that the grey area in the Dummy Indicator is meant for requesting information from the Tygron Platform using queries (TQL). The light blue area is meant for calculations - for instance adding and subtracting data from the Platform. The area on the far right is the html table meant for presenting the results.
- Check which (housing) Functions with solar panels are present in the Tygron Platform.
- Compose the right TQL queries necessary tot determine the amount of housing functions with solar panels per neighbourhood. Note that you need information about which neighbourhoods are present and how many (differtent kinds of) houses are present in both the Current and the Maquette state.
- Determine and Fill in the required calculations in your Excel Indicator. For instance, the increased amount of buildings with solar panels is obtained by subtracting the amount in the Current state from the amount in the Maquette.
- Think of how you want to show the results in the table in the Indicator panel and fill in the html table according to this.
- Add the Indicator to your project and test it.
- Optional: upgrade your Indicator. Add a column with the resources provided with the Solar Panels. Make an assumption for the resources per house with Solar Panels.
Excel example
TQL


Notes
- An example of an Indicator that was build following these steps can be found in the Public GeoShare named 'Solar panels indicator'.
External links
- http://www.tygron.com/en/2018/08/28/indicators/ How to implement Indicators in the Tygron Platform