Grid Overlay
What is a Grid overlay
A Grid Overlay is a calculated overlay. It uses a 2-dimensional grid for calculation, data storage, and visualization. The calculation divides the entire 3D world up into a grid of equally sized square cells, with possible size per cell ranging from 0.25m² up to 100m², depending on the size of the project area. This amounts to anywhere from thousands to millions of cells per overlay.
For each cell, a calculation is performed, the specifics of which depend on the overlay being calculated. This can be as simple as displaying (possibly inherently) rasterized data, such as GeoTiff Overlays or the heightmap, or as complex as multi-step rainfall calculations.
The results of a Grid Overlay can be visualized in the 3D world, exported as a GeoTiff, or queried using TQL.
Calculations
Depending on the exact overlay being calculated, the specifics of the calculation may differ, but the general approach is identical for each Overlay.
Each calculation relies on some data, which may be set as properties or attributes of the overlay, or may be based on the features present in an individual cell. This data is read from their respective locations as input for the calculation. Data from surrounding cells may also be included, in which their distance may also be factored in. If input for calculations may exist in multiple kinds of data, it depends on the exact calculation which data layer has preference. In general (for example, for attributes for an Average Overlay), the data layers are checked in the following order:
With all the data obtained, a new values or set of values is calculated for the cell, and stored as result data for that cell. The calculation may specify this processing repeating a large number of times, for example when iterating through time steps.
When the calculation is completed, a final result value is stored in the cell. The value stored in the cell itself is a unitless number. The exact meaning of the number is dependent on the overlay which defines the calculation. A calculation for noise will present its result in decibels. A calculation for subsidence in meters.
Using grid results
The results of a grid overlay calculation can be used in multiple ways.
Visualization
The results of the overlay are displayed in the 3D world. By selecting the overlay in the session interface, the world will be colored based on the calculated values. This allows the end-user to inspect the results visually and geographically.
The legend displayed while the overlay is active can be configured to fit the magnitude and intent of the colors of the overlay.
TQL
The results of the calculation can be queries using TQL. Queries can either retrieve data of the grid directly, such as the average value in a given location, or use it as a filter for other queries, by specifying a value the grid should have before taking that location into account.
Export
The results can be exported as a GeoTiff or ASCII file, allowing you to further process the results of the calculations performed in the Tygron Platform. See the article on Geo data for more information.
Save
The results of the calculation can be saved in the form of an inactive copy of the overlay. This creates an exact duplicate of the overlay, including it's attributes, legend, and current results. The duplicate will be inactive, so that when further calculations take place the duplicate still retains the results it had when it was created. The original overlay is unaffected, meaning if it was (still) active it would still be recalculated when new calculations take place. Because the duplicate is not active, saving an overlay will not affect the time it takes for the project to recalculate.
Settings
Grid overlays offer a number of settings to configure them to fit your use-case.
The grid overlays share a few settings, which influence the accuracy of the calculations. Depending on the calculation performed and the use-case forming the project's context, it may be desirable to tweak the settings used for the grid overlays. For performance reasons it is not possible to set grid overlay settings to different values for different overlays in the same project.
Grid size
The 3D world is divided up into cells of the specified size. The more cells that need to be calculated, the more resources (and in the end: time) it will take to complete the calculation. Depending on the use-case and the calculation being performed, it may be desirable to change the grid size used for the grid overlays. To change the grid cell size, see configuring grid settings.
The maximum amount of cells any given overlay or result type can have is 1 billion individual cells. For any given overlay, this includes the results of all timeframes of that overlay. Per project it is possible to have an Overlay with result types where the maximum amount of grid cells is 2 billion for the Overlay and the result types in total. You can have multiple Overlays + result type groups in your project. For example a Flooding Overlay with result types (max 2 billion grid cells) and also a Heat Overlay with result types (also max 2 billion grid cells). You can then for example add the Rainfall Overlay with result types (also max 2 billion grid cells) etc.
Note: if you select a grid size which does not neatly divide your project size, the south- and eastern edges of the project may not be covered by the grid, and not taken into account during a calculation.
Grid Accuracy Threshold
As the grid size decreases (and thus more cells exist in the project), calculations will take longer to complete. Under normal circumstances, when a calculation is based on geographical parameters, all contents of the cell are checked and all objects relevant to the calculation are taken into consideration based on how much of the cell is covered by it. When the grid size falls below this threshold, the method for determining these parameters changes. Instead, the exact center of the cell is checked, and if relevant data is found it is taken into consideration as if it were present in the entire cell. This is less accurate, but allows the calculation to complete faster.
Individual settings
Each individual grid overlay also has a few settings which can be set per grid overlay. These settings should be tweaked based on the actual meaning, intent, and impact, of the displayed results.
Active
Whether the grid overlay is active or not. When an overlay is inactive, the output of the overlay is not recalculated when an update or recalculation takes place. This means the results calculated by a grid overlay can be stored and inspected in a project without the computational overhead of performing the underlying calculation anew. This also means that the overlay's output may not represent the most recent evaluation of the state of the project. Instead, this option can be used to create results based on multiple scenarios, and to compare those to one another or to calculations which are updated along with changes in the project.
Legend
The visualization of the grid overlay in the 3D world can be changed by providing a legend for the grid overlay. The legend of a grid overlay consists of a list of values with related captions and colors. When that specific value is output by a grid cell, that grid cell is colored in the defined color. If the value lies between two defined values, the color will lie proportionally between the colors related to the defined values.
Difference option
Depending on the actions an end-user can take during a session, the difference between two states of a calculated overlay may not be directly visible. To help gain insight into the differences in the results of grid calculations, a grid overlay may be given a difference option. This means the end-user can activate a variant of the overlay which shows the amount of change between the original values, and the values resulting from the planned actions. This is effectively a separate grid with its own values, based on the actual calculation. The difference overlay can be further configured with its own legend.
Configuring grid overlays
Configuring grid settings
When any grid overlay has been added to a project, it is possible to change the settings for the grid calculations. The grid settings are shared across all overlays, so adjusting the settings via one grid overlay will affect all grid overlays in the project.
- Select any grid overlay in the editor.
- On the right panel, select "Change Grid".
- Change the cell size to the desired size.
- Change accuracy threshold to the desired threshold.
- Select "Send".
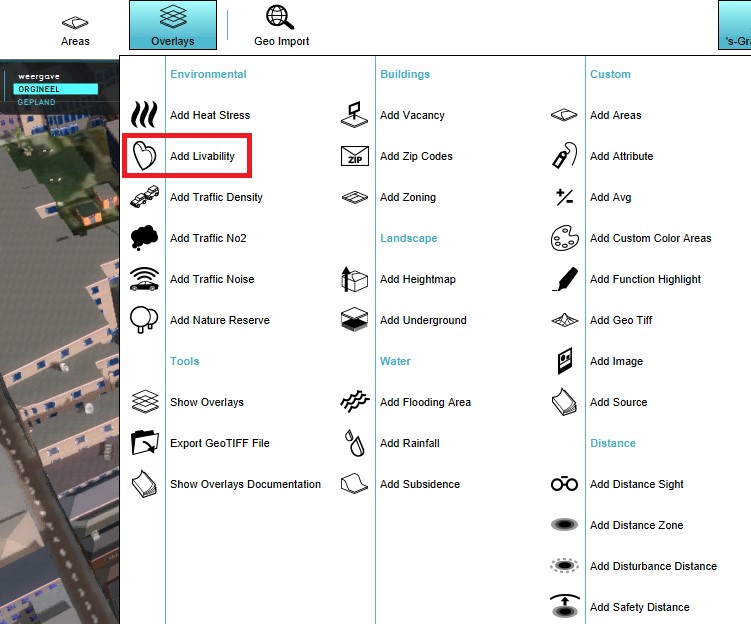
Select a grid overlay
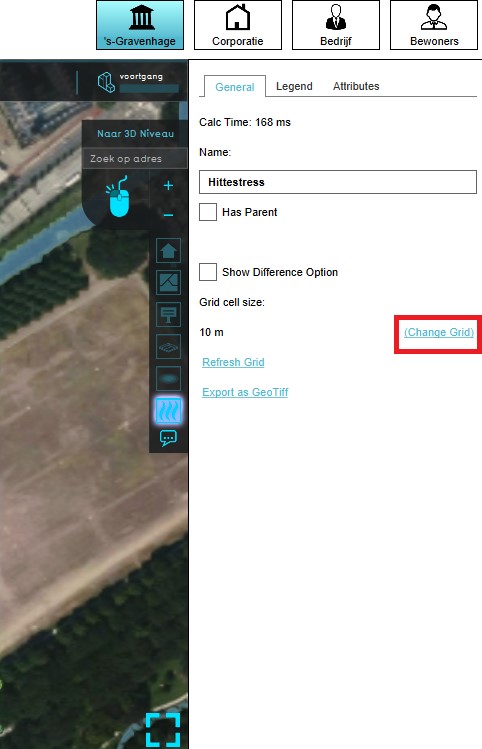
Select Change Grid in the right panel
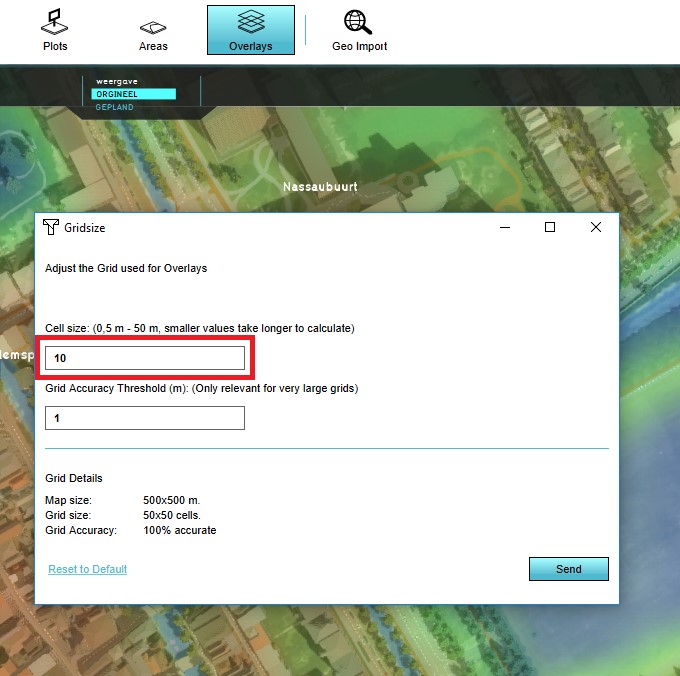
Change the cell size
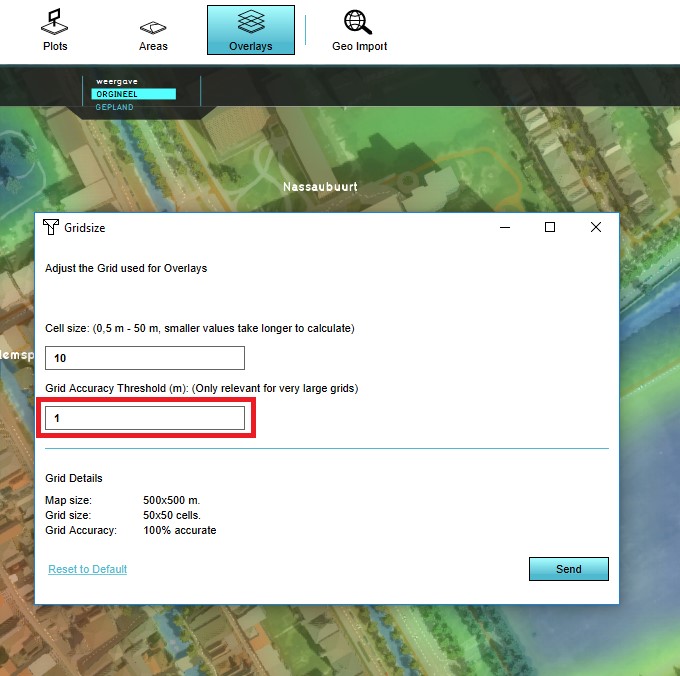
Change the accuracy threshold
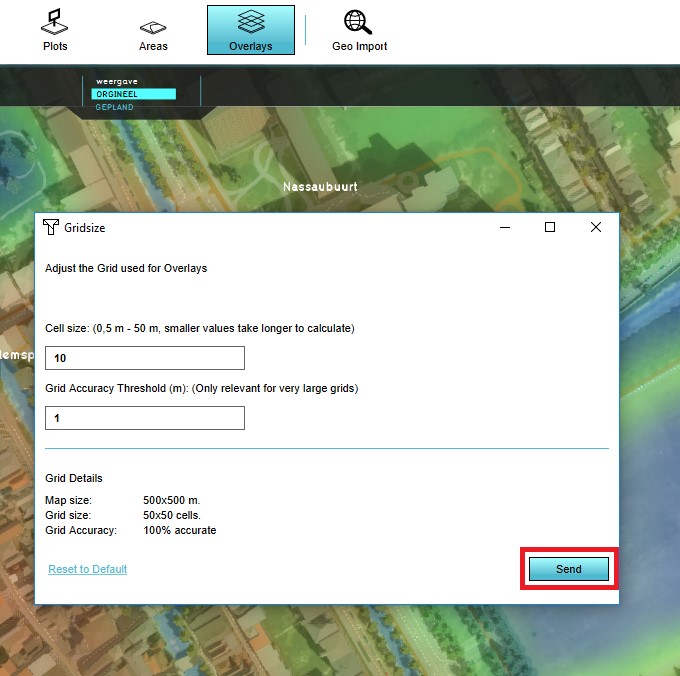
Select Send


- Select any grid overlay in the editor.
- On the right panel, select "Change Grid".
- Select "Reset to Default".
- Select "Send".
Select a grid overlay
Select Change Grid in the right panel
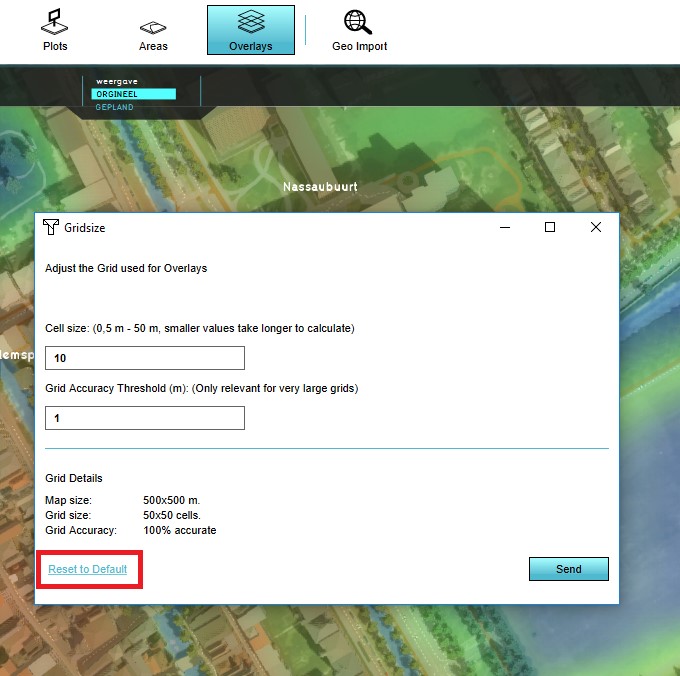
Select Reset to Default
Select Send

Configuring grid legend and visualization
To start defining the visualization for the grid overlay, first activate the custom overlay function for the overlay.
- Select the grid overlay you wish to configure in the editor.
- On the right panel, select the "Legend" tab.
- Make sure "Has Custom Legend" is checked.
Select a grid overlay
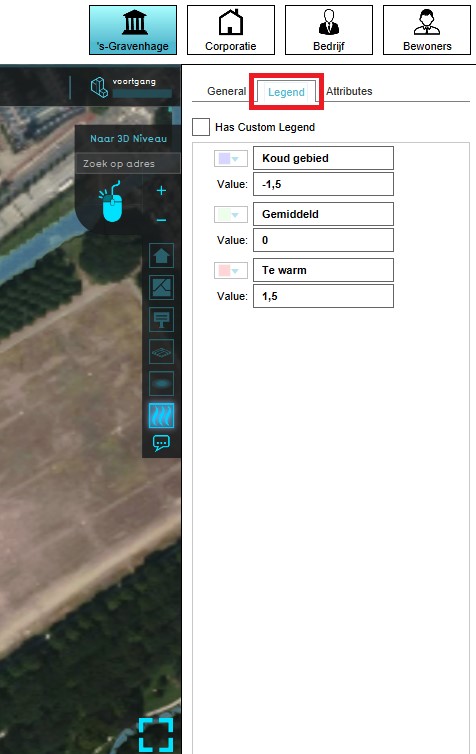
Select Legend in the right panel
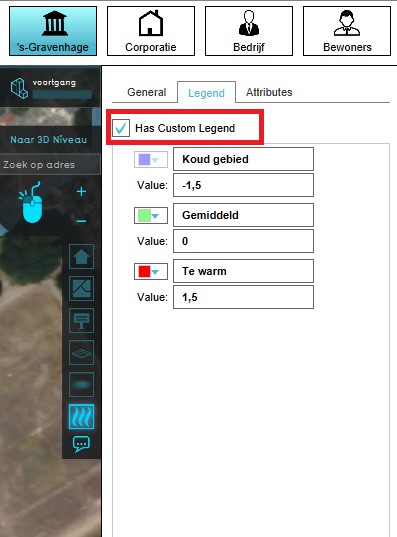
Select Has Custom Legend


Next, make sure that each color or value you wish to use is defined in the list of legend items.
- Select the grid overlay you wish to configure in the editor.
- On the right panel, select the "Legend" tab.
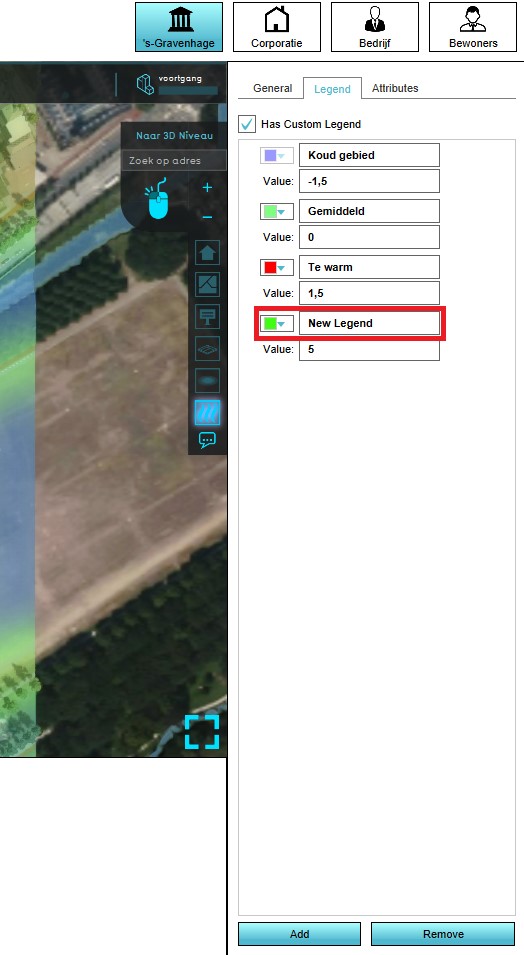
- Select "Add" at the bottom of the right panel.
- The new legend item is now added with a value of 0.
Select a grid overlay
Select Legend in the right panel
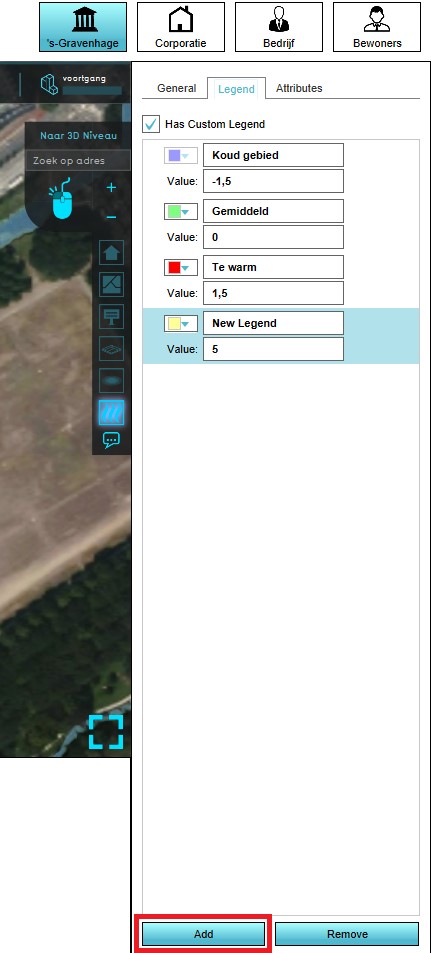
Select Add
This is the new Legend item


- Select the grid overlay you wish to configure in the editor.
- On the right panel, select the "Legend" tab.
- Select the legend item you wish to remove.
- Select "Remove" at the bottom of the right panel.
- The legend item is now removed.
Select a grid overlay
Select Legend in the right panel
This is the new Legend item
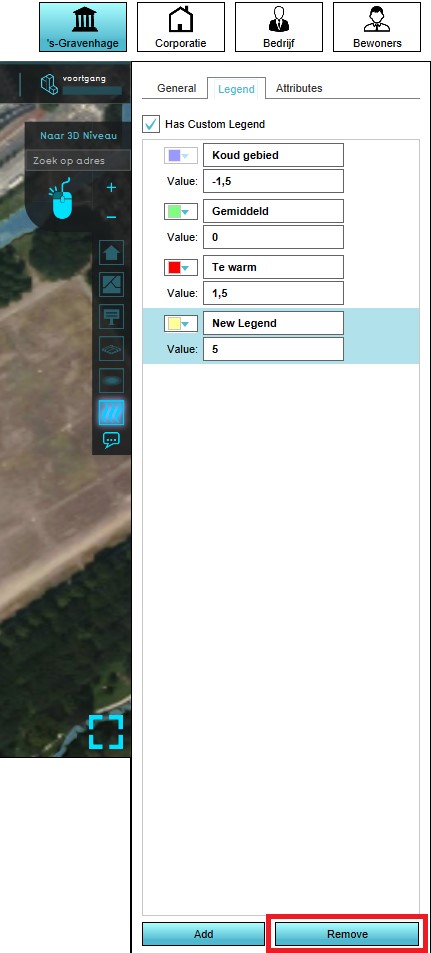
Select Remove

- Select the grid overlay you wish to configure in the editor.
- On the right panel, select the "Legend" tab.
- Select the legend item you wish to adjust.
- Change the "value" to the value at which you want to show the color.
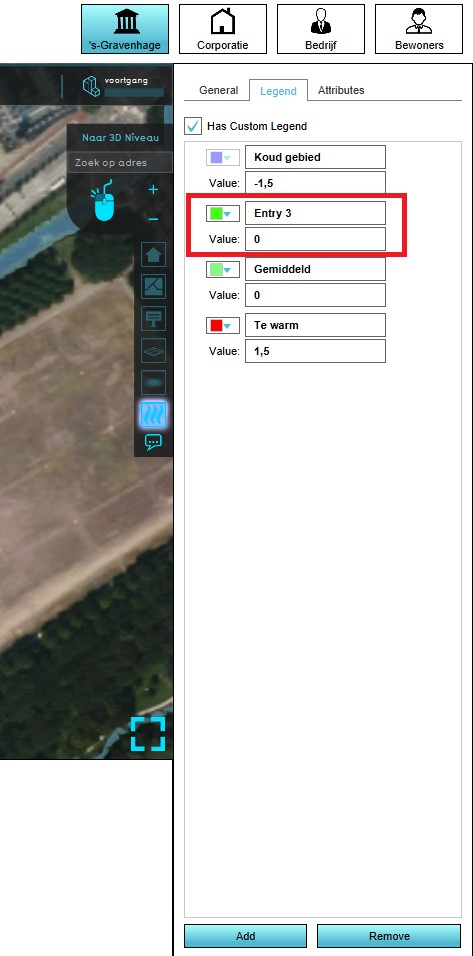
Note that the legend items are automatically sorted by value.
- Click on the color drop-down and select the color you wish to show.
- Change the text in the top input field of the legend item to change the caption for this color in the legend.
Select a grid overlay
Select Legend in the right panel
This is the new Legend item

Change the value of the color
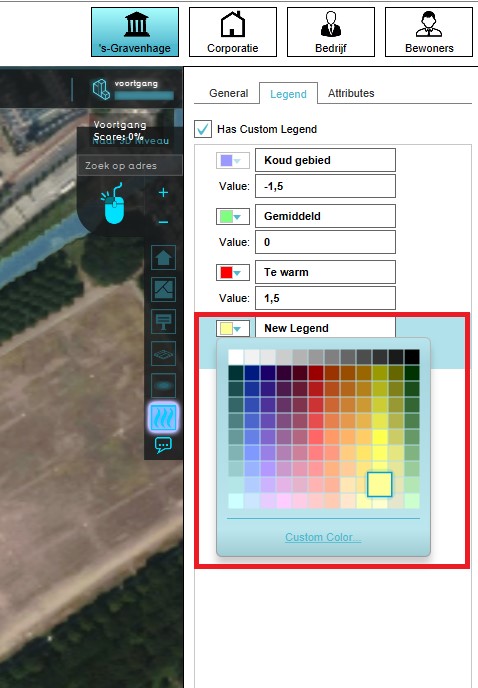
Change the color of the Legend item
Change the name of the Legend item


Configuring difference option
You can configure whether the end-user can activate a difference overlay or not on a per-overlay basis.
- Select the grid overlay in the editor.
- On the right panel, make sure "Show Difference Option" is checked.
Select a grid overlay
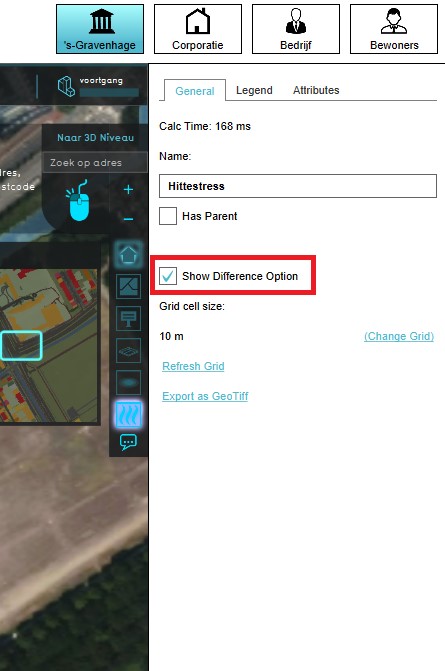
Check the Show Difference option

- Select the grid overlay in the editor.
- On the right panel, make sure "Show Difference Option" is unchecked.
Select a grid overlay
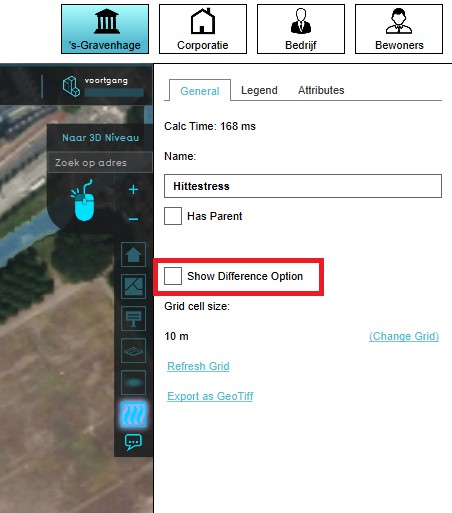
Uncheck the Show Difference option

Grid recalculation
During a session, grids are automatically recalculated whenever a change is made to the state of the 3D world, including non-geographical data such as globals or attributes. While editing, a grid is also updated when 3D World data is changed. However, some parameters can be changed in the editor which cannot be changed during a session, such as the properties or attributes of overlays. To prevent more complex overlays slowing down editing work, a grid overlay is not always automatically recalculated when these kinds of parameters are changed. To force the grids to recalculate, the "Update Now" option can be used on any grid overlay. This will force all grids to recalculate.
- Select any grid overlay in the editor.
- On the right panel, select "Refresh Grid".
Select a grid overlay
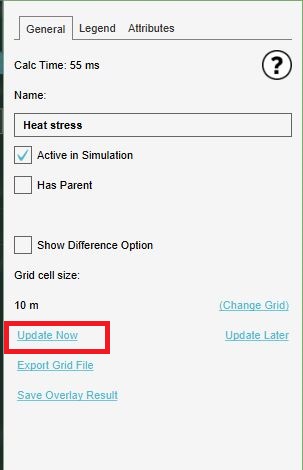
Select the Update Now option

Some overlays could be a delaying factor in the project. For more information see the troubleshooting page.
Delayed calculation
During business hours (9-17, GMT+1, during weekdays), there is a maximum calculation time of 1 hour. If a calculation takes longer than that, it will time out after 1 hour. Outside of business hours, calculations will not time out. If necessary, it is possible to postpone the recalculation of overlays until after business hours.
- Select any grid overlay in the editor.
- On the right panel, select "Update Later".