Project Sources and Demo San Francisco Project: Difference between pages
No edit summary |
No edit summary |
||
| Line 1: | Line 1: | ||
{{ | __NOTOC__ | ||
{{ | {|class="wikitable" style="margin: auto; background-color:#ffffcc;" | ||
| [[Demo_San_Francisco_Project_FAQ_%26_More|Next page>>]] | |||
|} | |||
[[File:San_francisco.png|thumb|right|300px|Project of San Francisco in the {{software}}]] | |||
{{demo project summary | |||
| title=Demo San Francisco | |||
| demographic= you if you are interested in GIS, BIM, data analysis, 3D visualization, urban planning and architecture | |||
| showcases= a 3D city model | |||
| image= | |||
| description=The ''Demo San Francisco'' project is a working project which shows an area in the San Francisco financial district, created from, among others, [[SLPK|I3S Scene Layer data]] and [[Project_Sources|OSM]] data. The demo project contains an analysis on the sky visibility from street level and insight into land use and building type. In this demo we will explore the contents of the 3D model, the used data to generate the model and the maps on building type, sky view and land use. | |||
| tutorial= | |||
}} | |||
== | ==Explore the current situation== | ||
# Zoom and click around in the project to inspect the 3D model. | |||
# Click in the Current Situation tab on the Overlays button and click in the left panel on Data Sources Overview. This map, the [[Source_(Overlay)|Source overlay]], highlights the used datasets in a 3D model. Notice the I3S San Francisco dataset is checked in the right panel. Notice most of the buildings in the 3D model are highlighted. This means data from the I3S Scene Layer is used to create these buildings. The black ribbon on the right is the overlay bar. Here you will find several [[Overlays|Overlays]]. An overlay is a 2D map on top of the 3D world. Notice that the palette icon is highlighted. The Data Sources Overview corresponds with the palette icon. Therefore to show the Data Sources Overview, you can also click on the palette icon. | |||
[[File:Sources_i3s.JPG|right|150px|Notice that the I3S dataset is checked. The Data Sources Overview shows where the I3S data is used.]] | |||
# Uncheck the I3S San Francisco dataset in the right panel and check the [[Project_Sources|OSM]] dataset. Notice that again almost all buildings are highlighted. This accentuates the effect that the {{software}} uses multiple data sources to create the 3D model. Take a look at the [[Project_Sources|project sources]] page to see all the (open) data we use to generate a new project. | |||
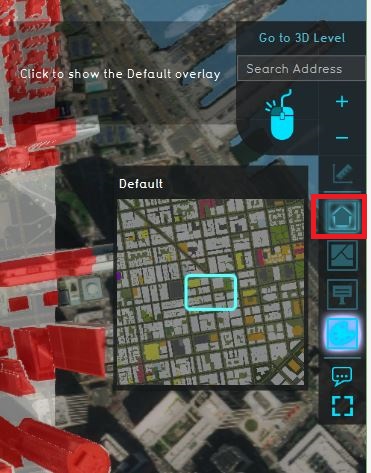
# [[File:City_overlay.JPG|right|150px|Click on the City overlay to go to the default view. ]]Click on the [[City_Overlay|City overlay]] in the overlay bar, depicted with the house icon to see the default 3D model without a map.{{clear}} | |||
# [[File:Attributes_building.JPG|right|150px|The attributes of the building.]][[File:Select_building_project.JPG|right|150px|Click in the Current tab on the Buildings button and click on the building with the arrow.]]We are going to inspect one of the buildings in the model. Therefore click on the [[Current_Situation|Current situation tab]] on the [[Constructions|Buildings]] button and select the building that is referred to with the arrow icon. In the right panel, the attributes such as the name of the building and its [[Function|function]] are displayed. Notice that this building has the function office, which is known from the [[Project_Sources|OSM]] dataset.{{clear}} | |||
# Select the Details tab and scroll through the different attributes and values. These attributes are called [[Function_Value|function values]]. Notice that some attributes have values and some attributes have a value of 0. These values are used in our [[Calculation_Models#Calculation_Models|calculation models]]. | |||
# Click again on the [[Constructions|Buildings]] button to close the menu on the right and click in the overlay bar on the [[Function_Highlight_(Overlay)|Function highlight overlay]] depicted with the pen icon. This overlay can highlight one or more functions in the 3D world. Notice from the legend this overlay shows the hotel [[Function|functions]]. | |||
# Zoom out a bit so that the whole 3D world is visible and click on the highlighted purple buildings. Notice that a hover panel pops up which also contains some information about the building. | |||
# Now click on the [[Sky_view_result_type_(Heat_Overlay)|Sky View overlay]]. This overlay shows the amount of sky visible from the street in direct line of sight (not hindered by any objects). Due to the high rise buildings, the sky view from some of the streets is minimal. To read more about how the sky view is calculated, see the used [[Sky_view_factor_calculation_model_(Heat_Overlay)|calculation method]]. | |||
# The next overlay is the Land use map. This overlay shows the Land use dataset downloaded and imported from [https://data.sfgov.org/Housing-and-Buildings/Land-Use/us3s-fp9q the DataSF website]. Click on some buildings to see more information (attributes) about a particular building or area. | |||
[[File:Sources_i3s.JPG|right|150px|Notice that the I3S dataset is checked. The Data Sources Overview shows where the I3S data is used.]] | |||
The | :''Proceed to the next page for more information and to read how to create a video or screenshot.'' | ||
<br> | |||
<gallery> | |||
File:Sources_i3s.JPG|2. Notice that the I3S dataset is checked. The Data Sources Overview shows where the I3S data is used. | |||
File:City_overlay.JPG|4. Click on the City overlay to go to the default view. | |||
File:Select_building_project.JPG|5. Click in the Current tab on the Buildings button and click on the building with the arrow. | |||
File:Attributes_building.JPG|5. The attributes of the building. | |||
File:Building_details.JPG| 6. Click on the Details tab to see the Function values. | |||
File:Hotel_data.JPG|7. Click on the pen icon. A map with the hotels in the project is now visualized. | |||
File:Hotel_more_information.JPG|8. Click on one of the purple buildings and notice the information in the hover panel. | |||
File:Sky_view_data.JPG|9. Click on the Sky view map. | |||
File:Land_use_data.JPG|10. Click on the Land use map. | |||
File:Land_use_more_info.JPG| 10. Click on one of the buildings to see more information in the hover panel. | |||
</gallery> | |||
{| class="wikitable" | {|class="wikitable" style="margin: auto; background-color:#ffffcc;" | ||
| [[Demo_San_Francisco_Project_FAQ_%26_More|Next page>>]] | |||
| | |||
| | |||
|} | |} | ||
Revision as of 09:09, 8 April 2020
| Next page>> |

The Demo San Francisco project is available for all users and can be found in the main menu under Edit projects. This project does not count towards your license.
This project is intended for you if you are interested in GIS, BIM, data analysis, 3D visualization, urban planning and architecture.
This project showcases a 3D city model.
The Demo San Francisco project is a working project which shows an area in the San Francisco financial district, created from, among others, I3S Scene Layer data and OSM data. The demo project contains an analysis on the sky visibility from street level and insight into land use and building type. In this demo we will explore the contents of the 3D model, the used data to generate the model and the maps on building type, sky view and land use.
Explore the current situation
- Zoom and click around in the project to inspect the 3D model.
- Click in the Current Situation tab on the Overlays button and click in the left panel on Data Sources Overview. This map, the Source overlay, highlights the used datasets in a 3D model. Notice the I3S San Francisco dataset is checked in the right panel. Notice most of the buildings in the 3D model are highlighted. This means data from the I3S Scene Layer is used to create these buildings. The black ribbon on the right is the overlay bar. Here you will find several Overlays. An overlay is a 2D map on top of the 3D world. Notice that the palette icon is highlighted. The Data Sources Overview corresponds with the palette icon. Therefore to show the Data Sources Overview, you can also click on the palette icon.

- Uncheck the I3S San Francisco dataset in the right panel and check the OSM dataset. Notice that again almost all buildings are highlighted. This accentuates the effect that the Tygron Platform uses multiple data sources to create the 3D model. Take a look at the project sources page to see all the (open) data we use to generate a new project.
- Click on the City overlay in the overlay bar, depicted with the house icon to see the default 3D model without a map.
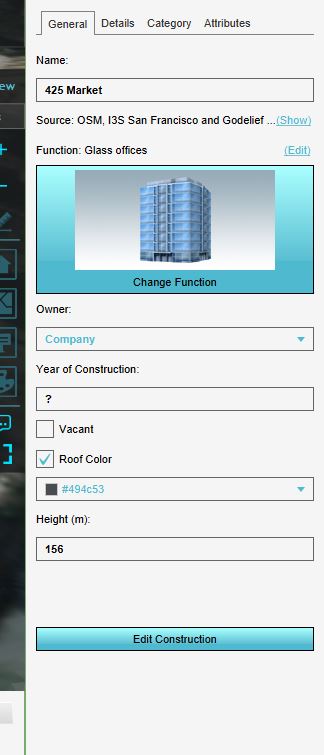 We are going to inspect one of the buildings in the model. Therefore click on the Current situation tab on the Buildings button and select the building that is referred to with the arrow icon. In the right panel, the attributes such as the name of the building and its function are displayed. Notice that this building has the function office, which is known from the OSM dataset.
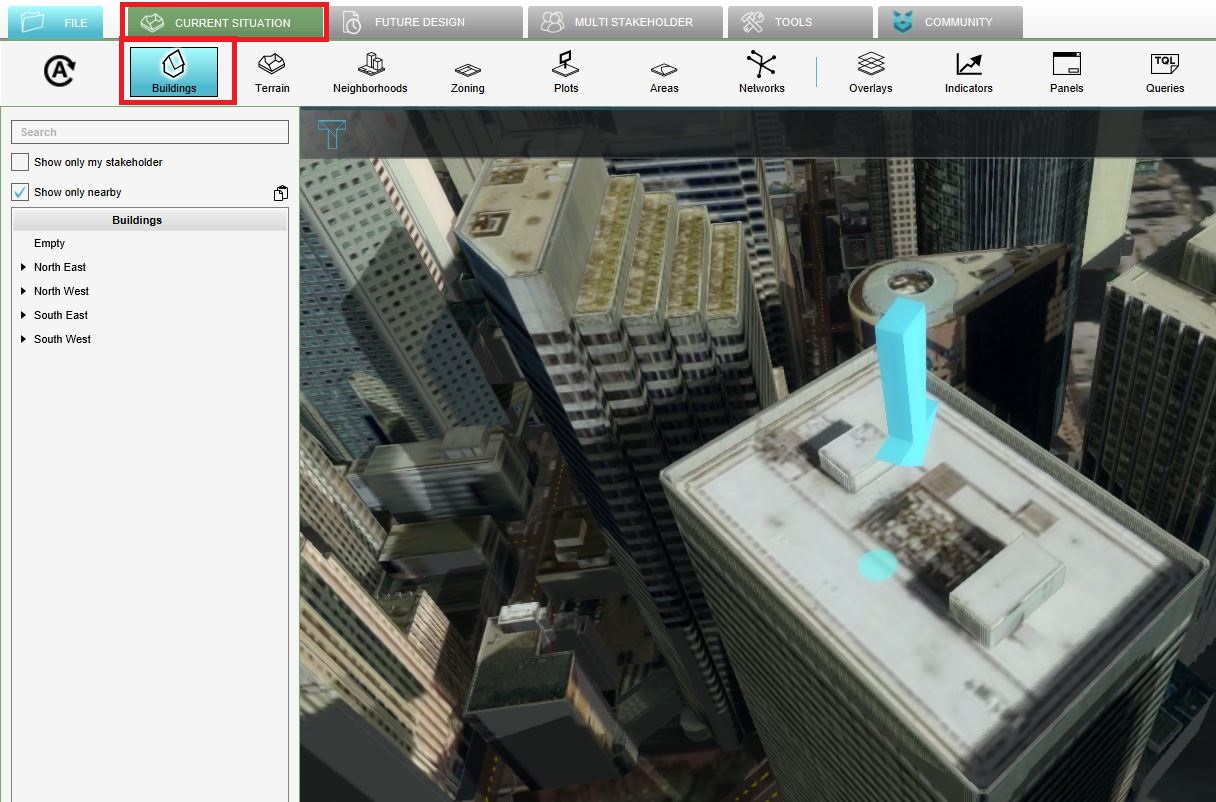
- Select the Details tab and scroll through the different attributes and values. These attributes are called function values. Notice that some attributes have values and some attributes have a value of 0. These values are used in our calculation models.
- Click again on the Buildings button to close the menu on the right and click in the overlay bar on the Function highlight overlay depicted with the pen icon. This overlay can highlight one or more functions in the 3D world. Notice from the legend this overlay shows the hotel functions.
- Zoom out a bit so that the whole 3D world is visible and click on the highlighted purple buildings. Notice that a hover panel pops up which also contains some information about the building.
- Now click on the Sky View overlay. This overlay shows the amount of sky visible from the street in direct line of sight (not hindered by any objects). Due to the high rise buildings, the sky view from some of the streets is minimal. To read more about how the sky view is calculated, see the used calculation method.
- The next overlay is the Land use map. This overlay shows the Land use dataset downloaded and imported from the DataSF website. Click on some buildings to see more information (attributes) about a particular building or area.


- Proceed to the next page for more information and to read how to create a video or screenshot.
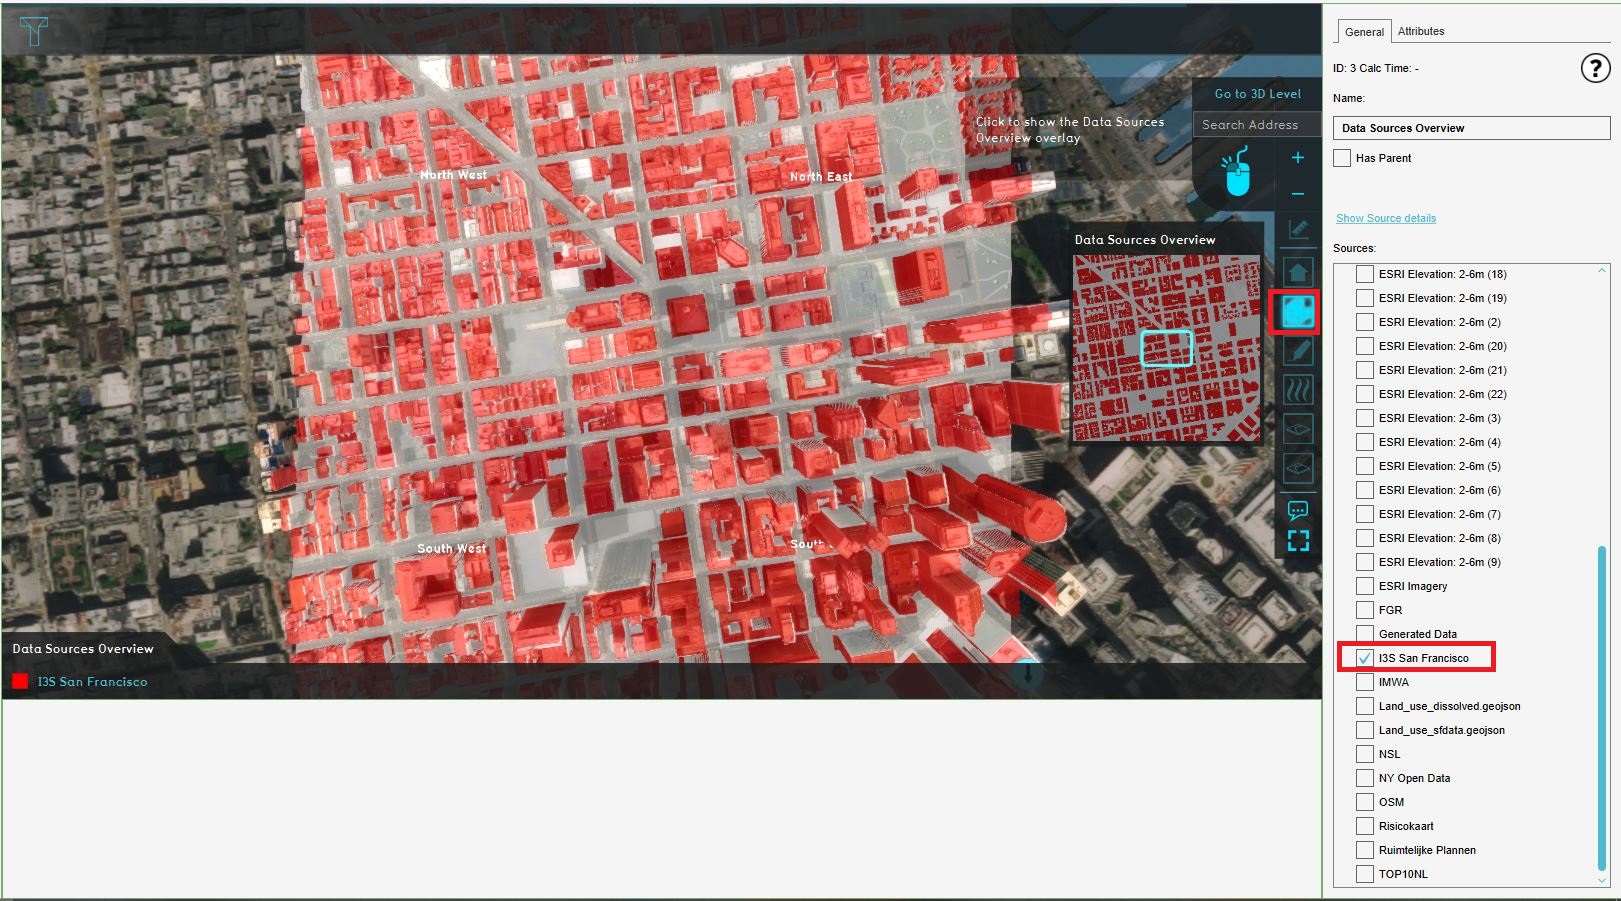
2. Notice that the I3S dataset is checked. The Data Sources Overview shows where the I3S data is used.
4. Click on the City overlay to go to the default view.
5. Click in the Current tab on the Buildings button and click on the building with the arrow.
5. The attributes of the building.
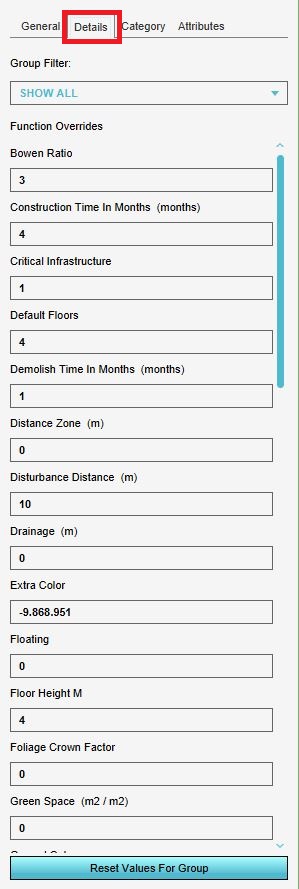
6. Click on the Details tab to see the Function values.
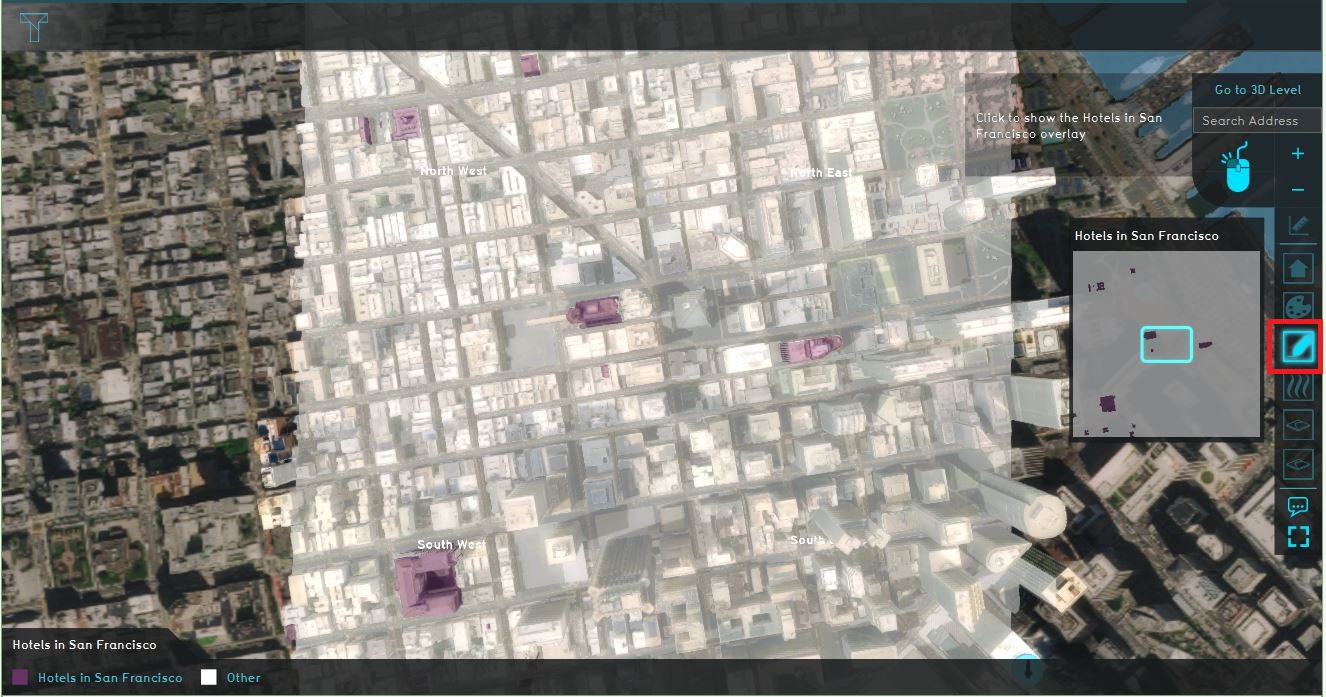
7. Click on the pen icon. A map with the hotels in the project is now visualized.
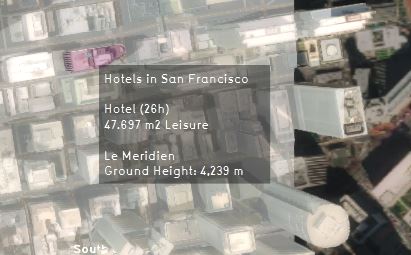
8. Click on one of the purple buildings and notice the information in the hover panel.
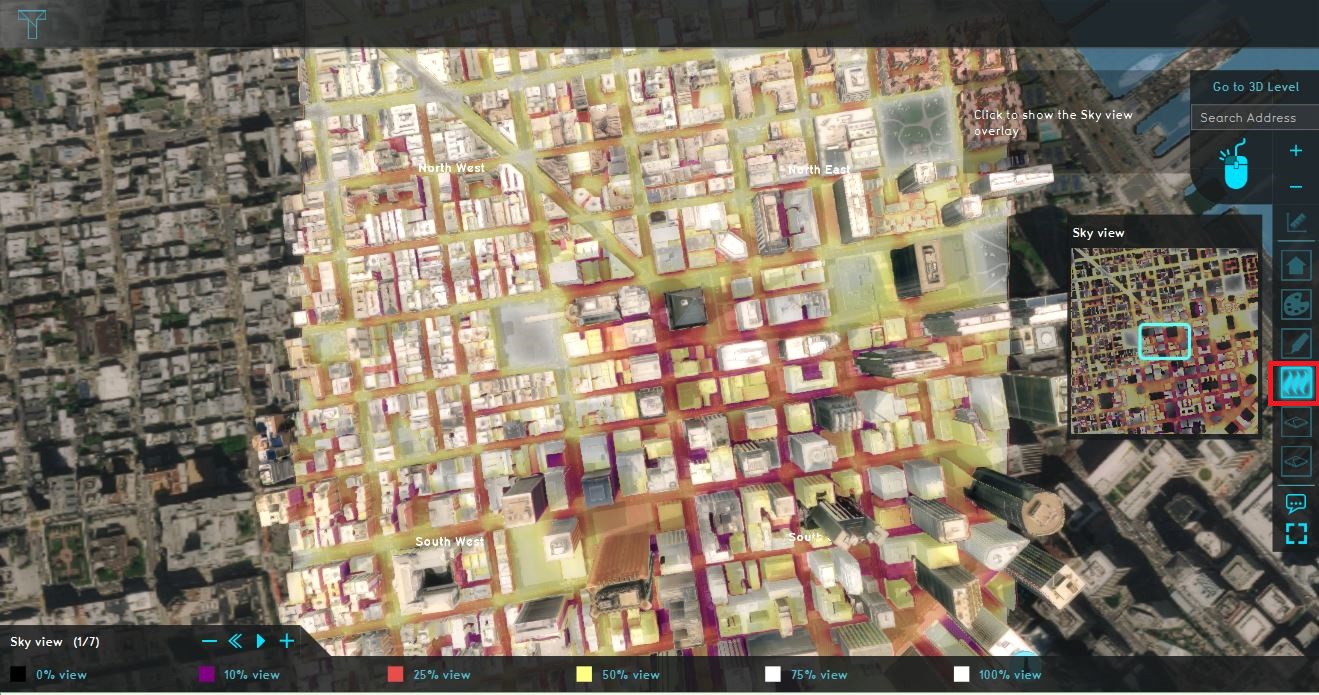
9. Click on the Sky view map.
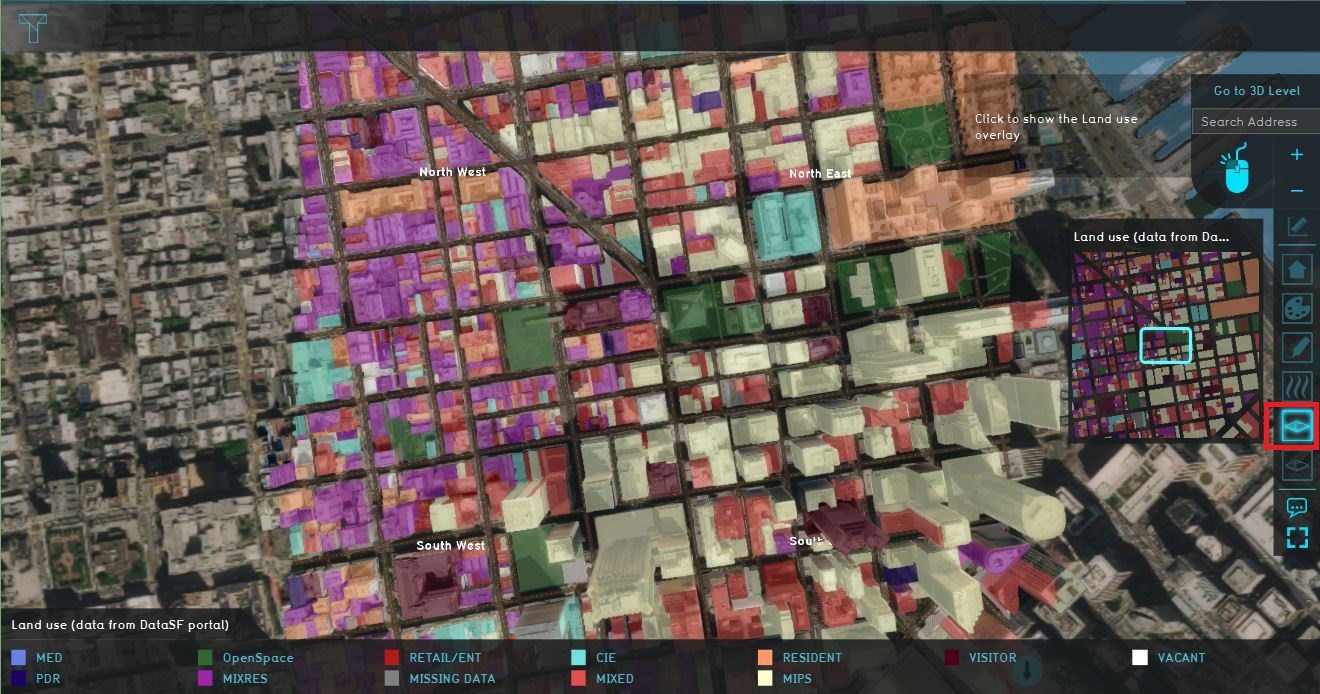
10. Click on the Land use map.
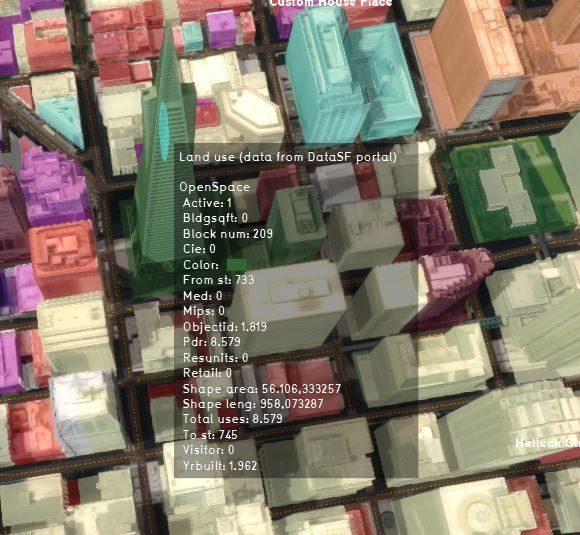
10. Click on one of the buildings to see more information in the hover panel.


| Next page>> |