Heat Stress Overlay
What the heat overlay is
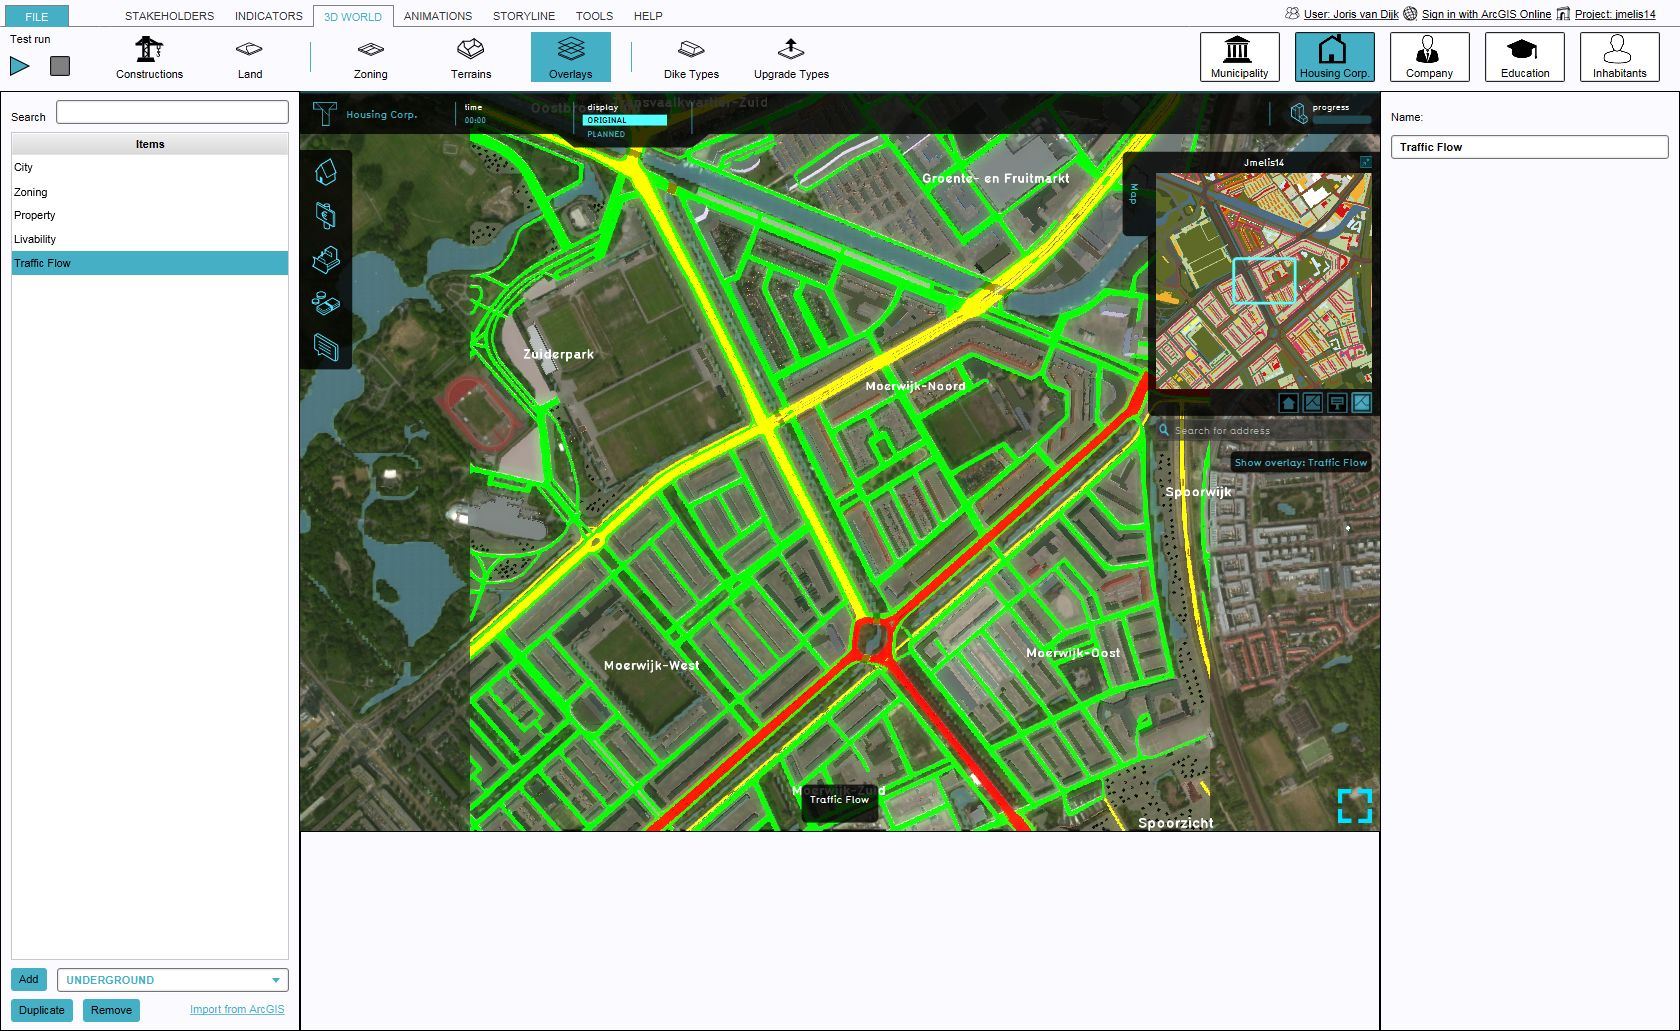
The heat stress overlay is an Overlay which displays the average temperature deviation (positive or negative) in different colors for the project area, indicating transitions in temperatures, resulting in heat-stress.
Color: Blue
Blue indicates the coolest area's, compared to the surroundings.
Color: Green
Green indicate cool area's, compared to the surroundings.
Color: Yellow
Yellow indicates warmer area's, compared to the surroundings.
Color: Red
Red indicates the hottest area's, compared to the surroundings.
Additional information displayed in hover panel
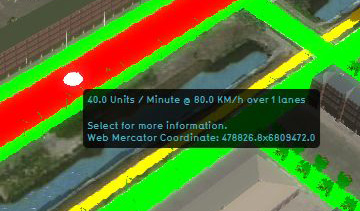
The hover panel gives additional information when the overlay is active.
Number of Units / Minute
The number of Units / Minute which flow across this road.
Speed
The average speed in km / hour which is driven on this road.
Number of lanes
The number of lanes this road consists of.
Adding and removing
For information on adding and removing Overlays see...

