Water stress (Indicator)
General
What is the water stress indicator?
The water-stress indicator yields insight into the flood resilience of built areas (default: neighborhoods) based on the fraction of total built area in that area which inundates beyond the preconfigured threshold inundation level (default: 0.05 m). Despite it being only a rather simplistic measure, it differentiates well between the more resilient (usually greener) areas and those less capable of dealing with excessive inflow of water.
Indicator panel
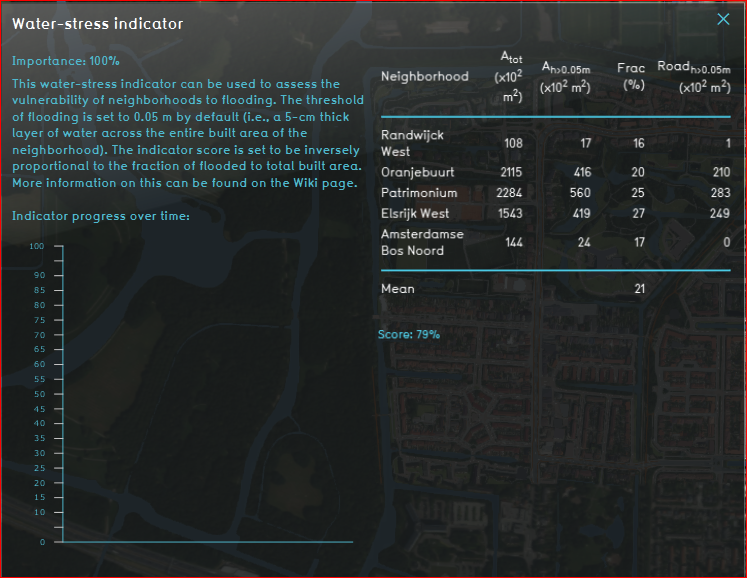
By default the indicator panel (Fig. 1) displays the following information:
- Name of neighborhood
- Total built area (m2)
- Built area exceeding the inundation threshold (m2)
- Ratio between the previous two parameters (%)
- Road/street area exceeding the inundation threshold (m2)
Note: the rightmost column is nothing more than a narrowed-down version of the 3rd column, so its values can never turn out higher.
Calculation
Score
A progress bar, that runs from 0 to 100%, keeps the user updated about the current state of the neighborhoods in their project in terms of flood resilience. The indicator score is set to be inversely proportional to the fraction of flooded (i.e., exceeding threshold) to total built area (averaged over the neighborhoods present in the project). For instance, if on average 21% of the built area exceeds threshold, the score will be set to (100-21=) 79%. The user decides whether they whish to display the absolute or relative score. Naturally, a higher score means better flood resilience and vice versa.
Additional configurations
For this indicator to function, only the Rainfall Overlay has to be added to the project, see below for the steps.
Add the Heat stress overlay
When the indicator is added to the project, an error message can be given. This is due to the missing Heat stress Overlay in the project.
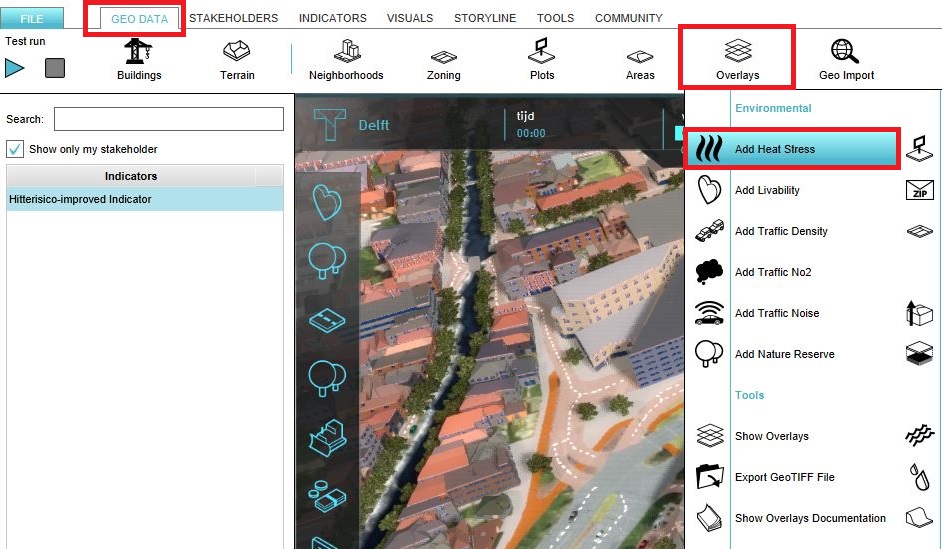
- Select in the editor 'Geo Data' from the ribbon
- Select 'Overlays' from the ribbon bar
- Select the Heat stress overlay from the drop down menu
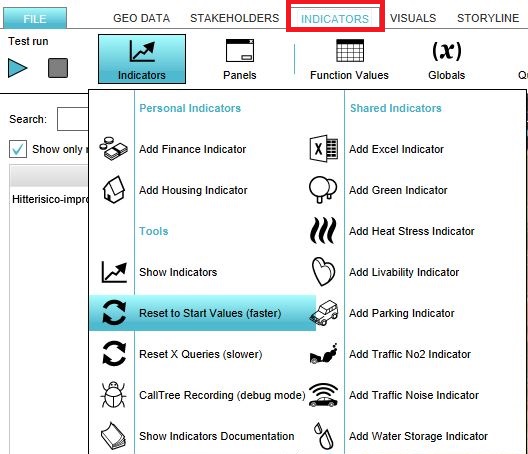
- Click on the tab Indicators and the button Indicators and choose for Reset to Start values (faster) to update your project.


