Ownership Overlay
What the Ownership overlay is
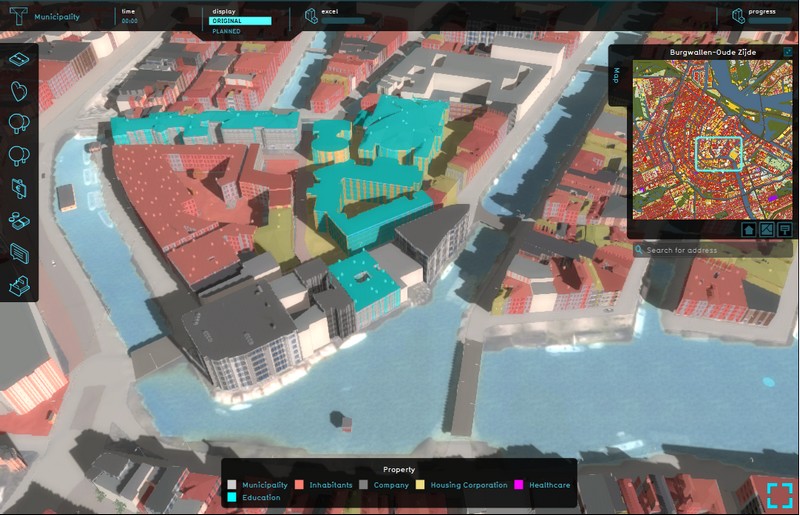
The Ownership overlay shows the different properties of the stakeholders in the project. The stakeholders are defined by the different parties who own land in the project area. Since ownership data is not Open data, the overlay is made up by combining different Open datasets:
- Parcel border data of Kadaster; for dividing the project into differenct parcels
- BAG; to know the function and size of buildings, for example functions as house, School or a Company
- Risicokaart; for knowing for example what is a School or a Hospital
- BRP gewaspercelen; to know what is Agricultural land
- BGT and TOP10NL; for knowing the topography of the project area
These datasets combined provided an estimation of who the owners of the land could be.
Generally, the Municipality owns roads and public green space. Agricultural land probably belongs to farmers.
To know if a building is owned by a housing corporation, if it is private property or if it is owned by another Stakeholder, the Engine first matches the building to the other datasets to know which type of building it is. For example, if is known from Risiockaart that the buildings is a School, the stakholer will be Education. If the data matching does not provide a stakholder, a best guess based on the size of units (houses) and the building will be done. Generally a large building with multiple smaller houses, will be of a housing corporation. A larger building with one or more houses will be private property.
Since this overlay is an estimation, we advise to import own ownership data if that is available to you.
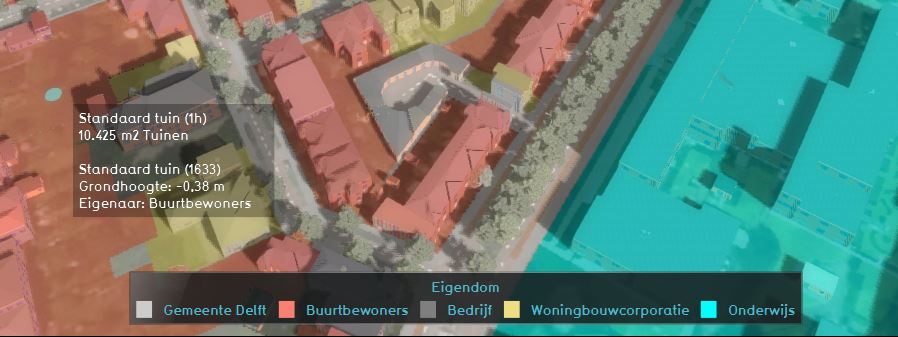
Additional information displayed in hover panel
When clicking on a specific location in the map, the hover panel gives additional information over the owner of the function, the height and the owner of the land.
Adding and removing
- Select in the editor 'Geo Data' from the ribbon
- Select 'Overlays' from the ribbon bar
- Select the Source overlay from the drop down menu
- Select in the editor 'Geo Data' from the ribbon
- Select 'Overlays' from the ribbon bar
- Select the desired overlay from the list of active overlays on the left panel
- Select 'remove' from the bottom of the left panel
- Confirm the removal in the pop up confirmation message

