Traffic Noise (Indicator): Difference between revisions
No edit summary |
|||
| Line 31: | Line 31: | ||
The indicator panel (see the image on the right) shows in a table per [[Neighborhoods|neighborhood]]: | The indicator panel (see the image on the right) shows in a table per [[Neighborhoods|neighborhood]]: | ||
* the neighborhood name | * the neighborhood name | ||
* the | * the amount of impacted buildings in this neighborhood | ||
* | * the total amount of buildings in this neighborhood | ||
* the | * the percentages score per neighborhood of buildings that are not impcated. | ||
===Calculation=== | ===Calculation=== | ||
Revision as of 11:38, 26 August 2019
Traffic Noise
Traffic Noise refers to noise disturbance that the buildings have due to the traffic density in a particular area.
How is the Traffic Noise indicator implemented in the Tygron Platform?
The Traffic Noise indicator calculates how much buildings in an area suffer from traffic noise.
The indicator scores based on the number of buildings that suffer from traffic noise per area. A lower number of buildings that are disturbed by the traffic noise means a better score.
How is the Traffic Noise indicator visualised?
The Traffic Noise indicator can be visualised using an overlay. This Traffic Noise Overlay displays the average noise that is produced for each part of the project detail area, giving an indication of the noise disturbance in that area.
This overlay becomes available for each stakeholder with an interest in the Traffic Noise indicator.
- Main article:Traffic Noise (Overlay).
Indicator targets
The Traffic Noise indicator has 1 value for a target.
- Number of buildings that suffer from traffic noise disturbance.
The number of buildings that suffer from traffic noise disturbance in a particular area. The lower, the better.
Indicator properties
This indicator is a global indicator. This means the indicator and its target are the same for all stakeholders.
This indicator is represented with a progress bar, representing a scale of 0 to 100% score.
The indicator functions by calculation. The number of buildings that are disturbed by the traffic noise is substracted from the total number of buildings in that area. From this a percentage of the traffic noise disturbance in that area is derived.
The indicator scores per area, for each area a percentage of the traffic noise disturbance is calculated. The score on the indicator as a whole is the average of the scores per area.
Stakeholders with this indicator also have access to the Traffic Noise (Overlay).
This Excel indicator can be downloaded from the Tygron Index. Read on to find out more about the indicator's calculation method and how to set it up in your project.
Indicator panel
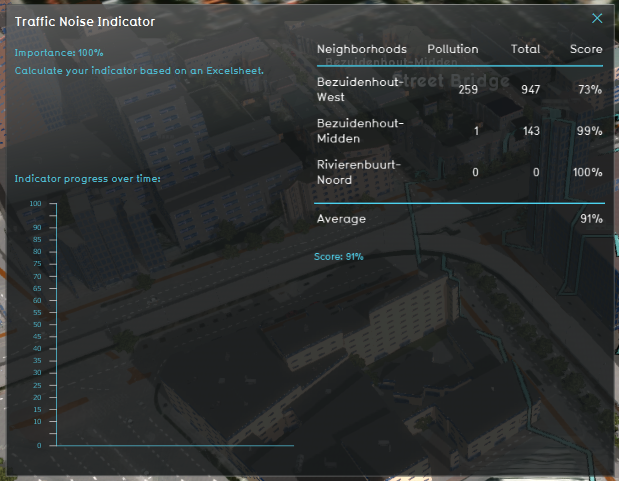
The indicator panel (see the image on the right) shows in a table per neighborhood:
- the neighborhood name
- the amount of impacted buildings in this neighborhood
- the total amount of buildings in this neighborhood
- the percentages score per neighborhood of buildings that are not impcated.
Calculation
First the heat stress in an area is calculated. For more information about this calculation, read the following section. More heat stress is a greater risk. Then the amount of people of 65 years are counted for each neighborhood. If there are more elderly people living in a neighborhood, there is a greater risk. The amount of houses after 2012 are counted as modern housing. The newer the houses are, the greater the risk. The risk is then calculated as: risk = Percentage elderly people x the heat stress in degrees.
Score
The score is represented in a progress bar, with a scale from 0 to 100%. Determine if you want to calculate the absolute or reative score. The higher the score, the less heat risk for the elderly there is.
Additional configurations
For this indicator to function, only the heat stress overlay has to be added to the project, see below for the steps. However, due to the reliance on CBS data which is a Dutch dataset, the indicator will only function on projects located in the Netherlands.
Add the Heat stress overlay
When the indicator is added to the project, an error message can be given. This is due to the missing Heat stress overlay in the project. Read below on how to add this overlay to the project.
- Select in the editor Current situation from the ribbon
- Hover over Overlays in the ribbon bar
- Select the Heat stress overlay from the drop down menu
- Hover over the Auto update icon and choose for Reset to Start values (faster) to update your project.
