Green MKP (Indicator): Difference between revisions
No edit summary |
|||
| Line 1: | Line 1: | ||
{{learned|what the green MKP indicator is|how the green MKP indicator is | {{learned|what the green MKP indicator is|how the green MKP indicator is calculated|how to adjust your project in order to make the indicator functional}} | ||
==General== | ==General== | ||
The MKP | The green MKP Indicator calculates per different area type a grade based on the amount of green in the area. The allocation of the area determines the calculation of the grade. Each type of area has different parameters for the amount and value of green. For example, an area with mostly industrial buildings is allowed to have less green than a residential area. | ||
This indicator is for example useful for projects in where: | This indicator is for example useful for projects in where: | ||
| Line 10: | Line 8: | ||
*(one of the) Goals is to work on reaching a certain green target | *(one of the) Goals is to work on reaching a certain green target | ||
*Different spatial plans are compared in the 3D world | *Different spatial plans are compared in the 3D world | ||
The green MKP Indicator belongs to the set of MKP indicators. Read more about the MKP indicators and the theory behind it on this page. | |||
===Indicator panel=== | ===Indicator panel=== | ||
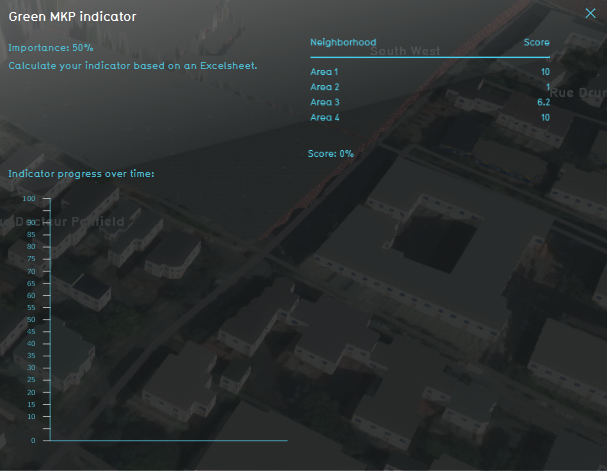
[[File:Green_MKP_indicator.png|thumb|The MKP Green indicator.|300px|right]] | [[File:Green_MKP_indicator.png|thumb|The MKP Green indicator.|300px|right]] | ||
The indicator panel shows the following information: | The indicator panel shows the following information: | ||
* The | * The area name | ||
* The score per | * The score per area | ||
{{clear}} | {{clear}} | ||
===Calculation=== | ===Calculation=== | ||
The indicator | The indicator calculates the amount of m2 green per neighborhood. This is backchecked against the allocation per neighborhood to calculate the score per neighborhood. | ||
===Score=== | ===Score=== | ||
The score is represented in a progress bar, with a scale from 0 to 100%. Determine if you want to calculate the absolute or relative score. The more green is located in a neighborhood, the higher the score is. | The score is represented in a progress bar, with a scale from 0 to 100%. Determine if you want to calculate the [[Indicators#Absolute_score|absolute or relative score]]. The more green is located in a neighborhood, the higher the score is. | ||
==Additional configurations== | ==Additional configurations== | ||
Revision as of 15:11, 2 April 2019
General
The green MKP Indicator calculates per different area type a grade based on the amount of green in the area. The allocation of the area determines the calculation of the grade. Each type of area has different parameters for the amount and value of green. For example, an area with mostly industrial buildings is allowed to have less green than a residential area.
This indicator is for example useful for projects in where:
- (one of the) Goals is to work on reaching a certain green target
- Different spatial plans are compared in the 3D world
The green MKP Indicator belongs to the set of MKP indicators. Read more about the MKP indicators and the theory behind it on this page.
Indicator panel
The indicator panel shows the following information:
- The area name
- The score per area
Calculation
The indicator calculates the amount of m2 green per neighborhood. This is backchecked against the allocation per neighborhood to calculate the score per neighborhood.
Score
The score is represented in a progress bar, with a scale from 0 to 100%. Determine if you want to calculate the absolute or relative score. The more green is located in a neighborhood, the higher the score is.
Additional configurations
For this indicator, an area in which the area neighborhood allocations are determined has to be added to the project. The GeoJson file can be created in a Gis program before this is uploaded to the Tygron platform. See below for the steps.
Add the Safety Distance Overlay
- Select in the editor 'Current Situation' from the ribbon
- Hoover over 'Areas' from the ribbon bar
- Select Import Geo data
- Follow the steps in the wizard.
