Density indicators: Difference between revisions
| Line 31: | Line 31: | ||
For the calculation of the indices, you can look at it at different scales: plot, building block, neighborhood, district and municipality. For this calculation the neighborhood is chosen. It is possible to change the indicator to calculate on another scale or add a new neighborhood to your project which consists of your plan area. | For the calculation of the indices, you can look at it at different scales: plot, building block, neighborhood, district and municipality. For this calculation the neighborhood is chosen. It is possible to change the indicator to calculate on another scale or add a new neighborhood to your project which consists of your plan area. | ||
===Score=== | ===Score=== | ||
Revision as of 11:58, 4 March 2021
General
What are the Density indicators?
The Density indicators exists of three indices which define density in an area. These are:
- FSI - Floor Space Index or Floor Area Ration; which gives information about the intensity of the buildings in relation to the open space. The higher the index is, the more buildings and/or floors there are.
- GSI - Ground Space Index; which gives information about the relation between built and open space. The lower the index is, the more open space there is in the area.
- OSR - Open Space Ration; which gives information about the spaciousness and pressure on the open space. An high FSI ensures a low OSR. The higher the OSR is, the more open space there is.
This indicator is useful for projects where for example:
- Density analysis is an important aspect of the project
- a new neighborhood is designed
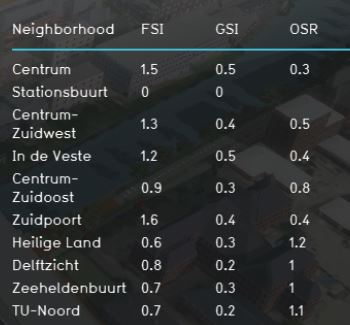
Indicator panel
The indicator panel shows per neighborhood:
- the neighborhood name
- FSI score
- GSI score
- OSR score
Calculation
The calculation for the indices is as follows:
- FSI = Foorspace (floorspace) / landsize neighborhood
- GSI = Lotsize (footprint) / landsize neighborhood
- OSR = (1-GSI) / FSI
For the calculation of the indices, you can look at it at different scales: plot, building block, neighborhood, district and municipality. For this calculation the neighborhood is chosen. It is possible to change the indicator to calculate on another scale or add a new neighborhood to your project which consists of your plan area.
Score
For this indicator no score is being calculated. The progress bar shows always 100% (fixed number).
Additional configurations
For this indicator to function, no additional configurations are needed. However, extra Overlays can be made to make the indicator also visual in a map. Below the steps on how to create the overlay:
- Select Geo Data and then Overlays in the ribbon header
- Add the Avg overlay
- In the right panel, give the overlay the name FSI
- Click on the Configuration Wizard
- Choose: gain insight into grid cell values
- Click on select and choose the FSI attribute
- Choose Specific layer only and then the neighborhood layer
- Finish the wizard
- Now the overlay is created
- Follow the same steps for the GSI and OSR overlay.
