Handout Water Module: Difference between revisions
| Line 24: | Line 24: | ||
''Note that it is not possible to return to the original heightmap. Therefore it is strongly advised to work with different verisons of your project, to always have the opporunity to go back to a previous version in case something went wrong with importing data.'' | ''Note that it is not possible to return to the original heightmap. Therefore it is strongly advised to work with different verisons of your project, to always have the opporunity to go back to a previous version in case something went wrong with importing data.'' | ||
* Hover over the Overlays button in the Current Situation tab. | |||
* From the Landscape category, add the Digital Terrain Model. Now a heightmap will be added to your project. | |||
[[File:Add_heightmap.PNG|700px]] | |||
* In the left panel, see the corresponding overlays with the Overlay bar. In the right panel, change the grid cell size by clicking on Change grid and fill in 2m. | |||
[[File:Change_grid_size_heightmap.PNG|700px]] | |||
* Hover over the Terrain button in the Current Situation tab. | |||
* Click on Select Elevation Geotiff. | |||
[[File:Select_elevation_geotiff.PNG|400px]] | |||
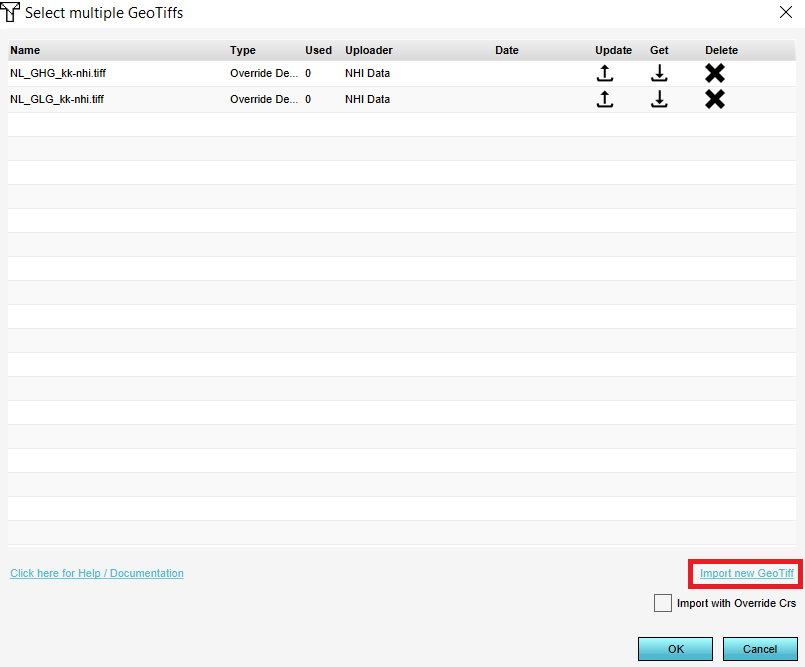
* In the panel that pops up, click on Import Geotiff and and select your raster file. The file is now being uploaded. | |||
[[File:Import_geotiff.PNG|400px]] | |||
* Select the just uploaded file and click on OK. The new heights will be applied to the heightmap. Click on the Digital Terrain Model icon in the Overlay bar and notice the updated heightmap. | |||
=== Add the Rainfall Overlay === | === Add the Rainfall Overlay === | ||
Revision as of 12:22, 10 June 2021
This handout can be used for the water module basic training or as a recap for advanced training courses.
How to use: Advise is to print this handout and use it during one of the training courses we offer to take notes on. Afterwards, you will have an overview of what you have learned during the training.
Note: This handout is not a standalone tutorial but provides an overview of what you have learned during a training. For a tutorial regarding the Water module which you can practice with on your own, see the Rainfall Overlay tutorial.
The subjects in this hand out are:
- Create a New Project; how to create a new project for a water related use case
- Import water depth data; how to add water depth data to enrich the project
- Add the Rainfall Overlay
- Walkthrough of the Water overlay Wizard
Create New Project
- Click in the Main Menu on New Project
- Provide a name for the New Project (max 20 characters) and click on Empty Project.
- For the location, fill in a location of your choice and click on Enter. Move the square with the left mouse button. The part of the map in the square will be your 3D world. With the sliders on the right side, it is possible to enlarge the square. However, the smaller the square is, the faster the 3D model will be generated. For the following steps, choose a size of max 2 x 2 km.
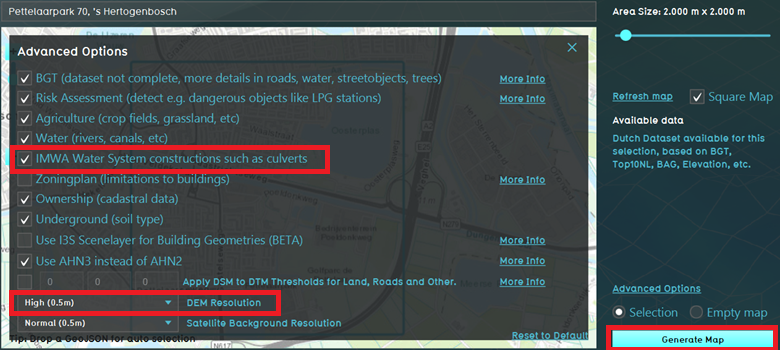
- Then click on Advanced Options
- Here you can check datasets that are used to generate the 3D world. By default, the IMWA data source is checked by which Culverts are automatically imported (if they are available for your location as open data). If you have your own Culvert dataset, you can uncheck the IMWA data source here. Also make note of the DEM resolution. Select a high DEM resolution to use the most accurate AHN data.
- Finally click on generate map to generate the 3D world from open data.
Import water depth data
From open data, the depth of a water body is not known. Read here how the Tygron Platform models water depths. Depending on the use case of your project, it can be important to add own data with the height of the water bottom.
Note that it is not possible to return to the original heightmap. Therefore it is strongly advised to work with different verisons of your project, to always have the opporunity to go back to a previous version in case something went wrong with importing data.
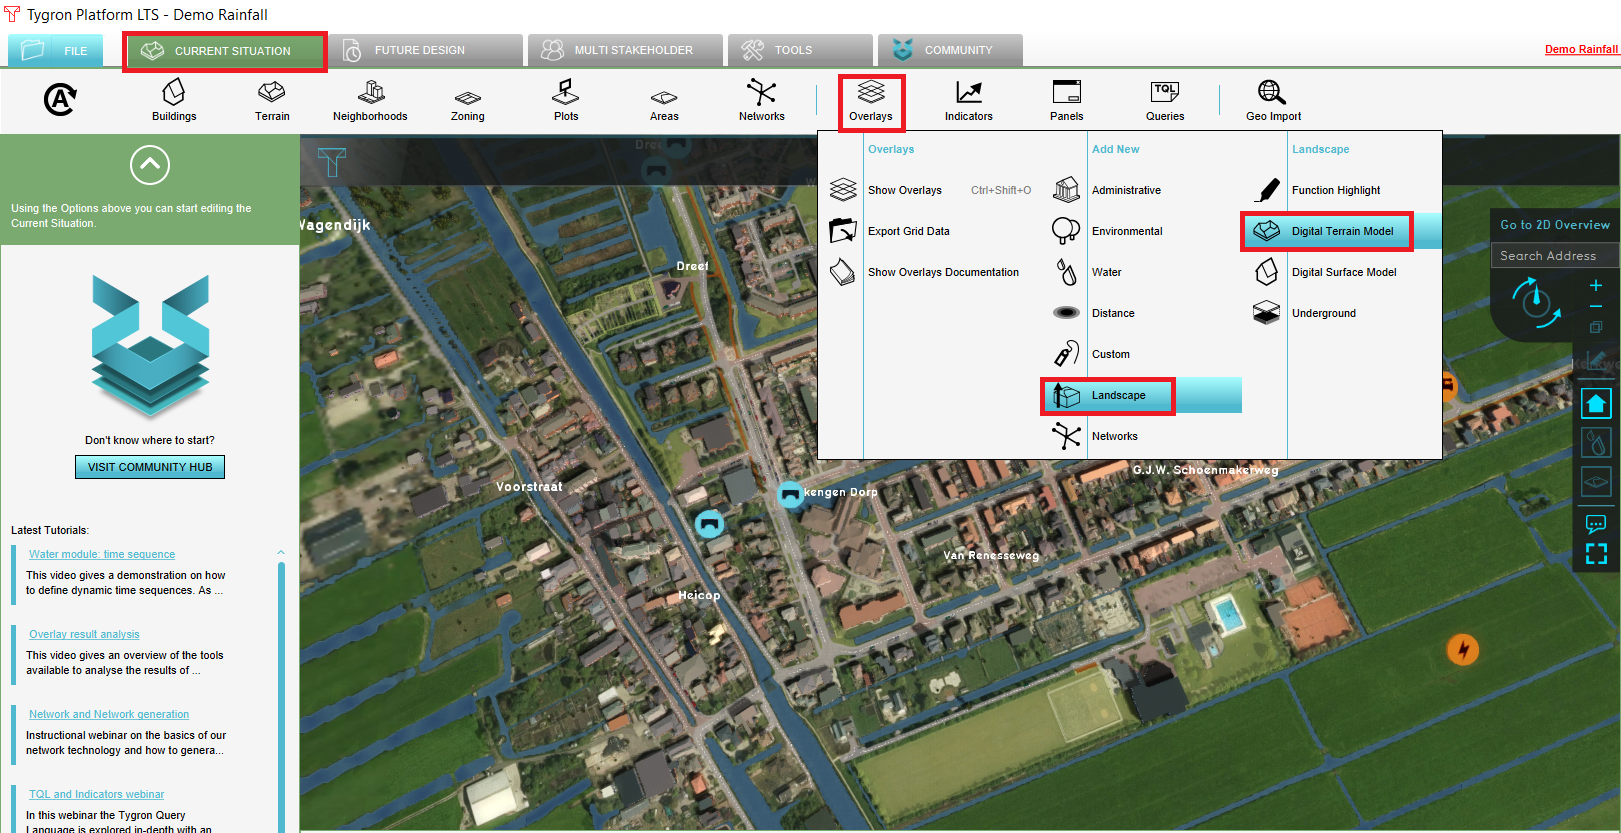
- Hover over the Overlays button in the Current Situation tab.
- From the Landscape category, add the Digital Terrain Model. Now a heightmap will be added to your project.
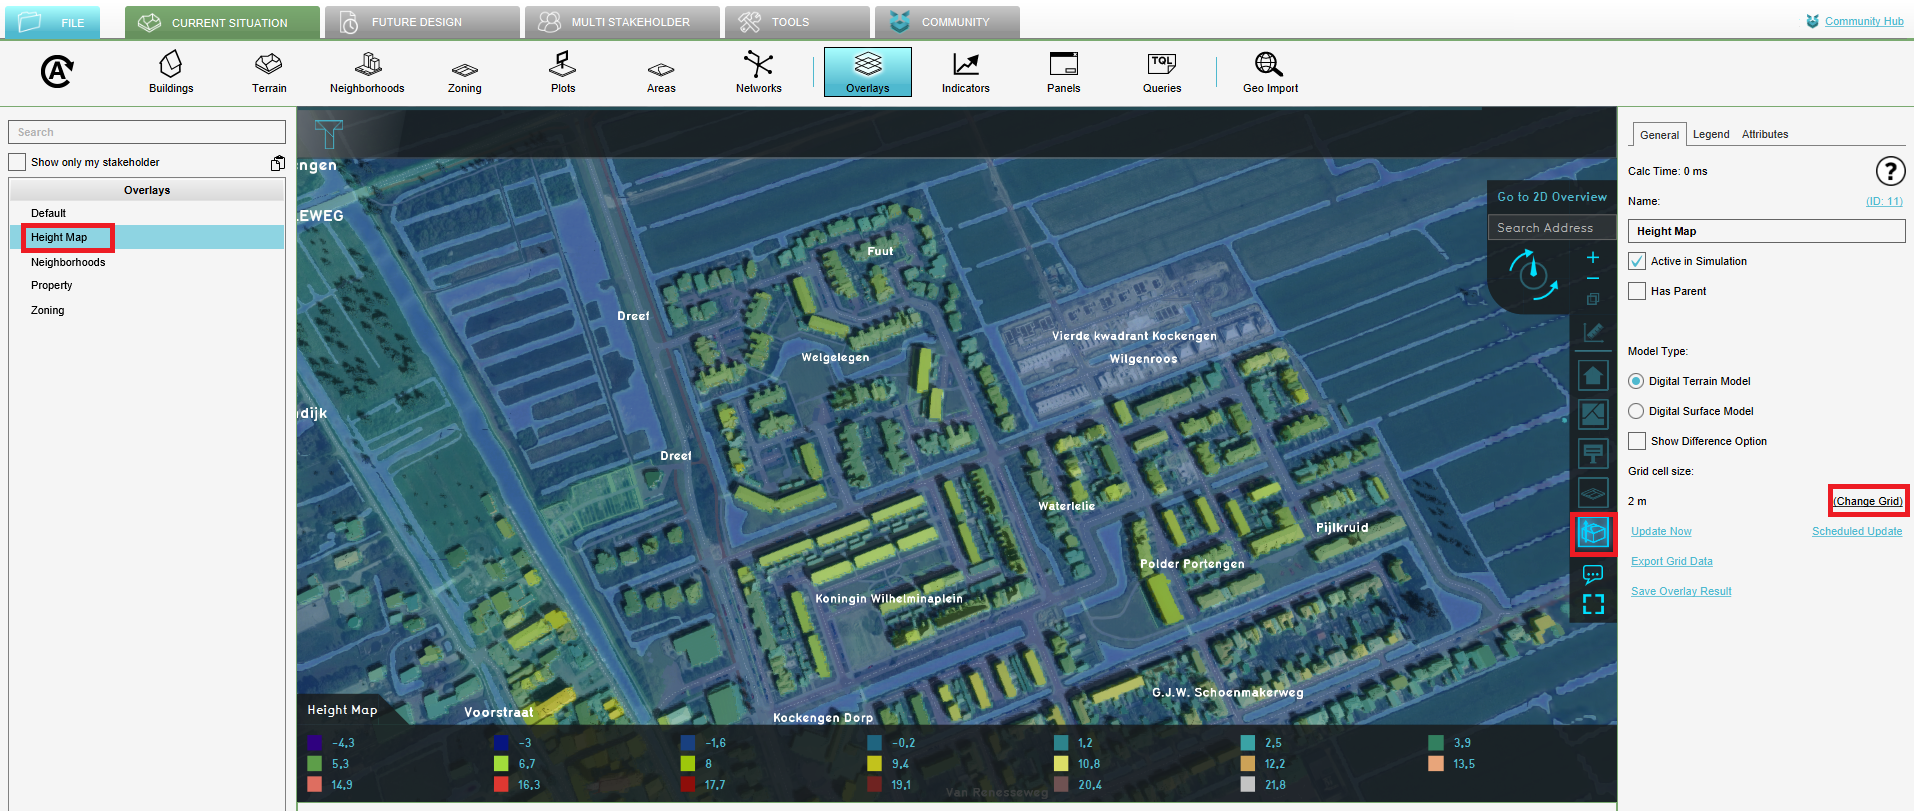
- In the left panel, see the corresponding overlays with the Overlay bar. In the right panel, change the grid cell size by clicking on Change grid and fill in 2m.
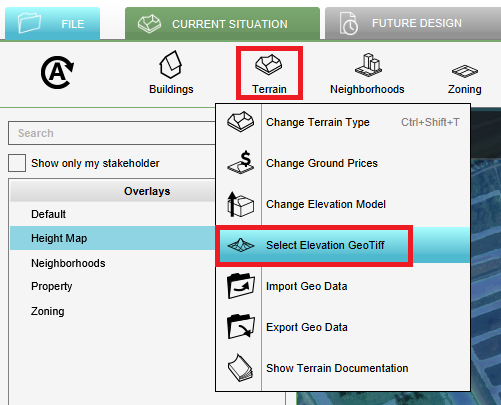
- Hover over the Terrain button in the Current Situation tab.
- Click on Select Elevation Geotiff.
- In the panel that pops up, click on Import Geotiff and and select your raster file. The file is now being uploaded.
- Select the just uploaded file and click on OK. The new heights will be applied to the heightmap. Click on the Digital Terrain Model icon in the Overlay bar and notice the updated heightmap.
Add the Rainfall Overlay
For the following steps, you can practice with the Rainfall Overlay tutorial.
- In the Current Situation tab, hover over the Overlay button and add from the Water category the Rainfall Overlay.
- In the left panel, notice that the Rainfall Overlay is added to the project.
- Select in the left panel the Rainfall Overlay and click in the right panel on the Configuration wizard. In the following steps this Water Overlay Wizard will be completed to import the water system and configure settings to simulate a rainfall scenario.
Water Overlay Wizard
For the following steps, you can practice with the Rainfall Overlay tutorial.
Rainfall and simulation time
- In the first step of the wizard fill in the amount and the duration of the rain. Also fill in the simulation time.
- Leave the settings for Groundwater on the mode Infiltration only.
Water areas and Groundwater
- In step 2.1 choose to generate or import Water areas. When choosing generate, one water area the size of the project area is created. Enter the water level for this area. It is also possible to import own water areas.
- Check if there are no error messages by folding out the drop down menu. If (one of the) water areas is marked red or orange, there is an error or warning. If there is an error, change the water level according to the error message. Then click on Next.
- In step 2.2 Groundwater click on Next
Sewer areas
Depending on the use case, sewer areas are/are not important.
- In step 2.3 choose for the option to import own Sewer areas or choose to Generate Sewers. Based on the Urbanization factor, sewer areas are generated.
- If you have a dataset with sewer overflows, uncheck the Generate Sewer overflows option and click on Next. If you do not have this dataset, then check this option to automatically create sewer overflows for every sewer area and click on Next.
Import Weirs
- Choose in step 2.5.1 Weirs for the option to import Weirs and then click on the button Import weirs.
- Follow the steps in the Geo Data Wizard to import weirs. Take note of the the type of data you want to import. If the weirs are points, they should be buffered to create polygons. Choose a suitable name for the weirs to recognize them later on. In step 7 choose the names of the requested attributes that are used to calculate with.
- Finish the Geo Data Wizard
- Check if there are no error messages by folding out the drop down menu. If (one of the) weirs is marked red or orange, there is an error or warning. If there is an error, change the attributes according to the error message. Then click on Next.
Import other Hydraulic structures
- Repeat the steps for weirs to import the other hydraulic structures such as culverts, pumps, inlets and sewer overflows.
Culverts are automatically imported when the IMWA data source is checked. Note that not all attributes/keys have a value and that therefore default values are used. For example for the diameter of a culvert. When importing own culvert data, tote that Culverts are usually line data. Take note to buffer these lines to create polygons in the Geo Data Wizard. Pumps and inlets are usually point data which also need to be buffered.
- If you have generated sewer areas with sewer overflows, it is not needed to import own sewer overflows (unless desired).
Result types
- Change, if desired, the attributes in step 3 and click on Next until you are at step 5.
- In step 5 select the result maps you would like to see in your project. Useful result types are Surface elevation, the Surface last value, Surface max speed and the Base types.
- Then select the amount of timeframes in the next step. Take into account the simulation time (step 1 of the wizard) and the use case, so that you have, for example, a timeframe every 15 minutes.
- Finish the wizard. The Rainfall will now be calculated. When the calculation is finished, see the result types in the left panel. In the right panel, more information can be found per result type. Click on the Play button to see the simulation.
