Roadmap: Difference between revisions
| Line 50: | Line 50: | ||
===Current development on test server=== | ===Current development on test server=== | ||
*New | *New 2D GIS Webbrowser Viewer. | ||
* | *Generating 30x30KM Maps with Hi-End hardware. | ||
* | *Interface improvements including new pop-up icons. | ||
*More feedback for Excel calculations: e.g. a file wich shows calculation times of specific tables. | |||
===Recent previous versions=== | ===Recent previous versions=== | ||
Revision as of 12:34, 17 January 2017
What is a Roadmap?
A technology roadmap is a plan that matches short-term and long-term goals with specific technology solutions to help meet those goals. It is a plan that applies to a new product or process, or to an emerging technology.
from: https://en.wikipedia.org/wiki/Technology_roadmap
How does the Roadmap relate to the Tygron Engine?
The R&D department of Tygron develops new technology for the Tygron Engine. The long term planning which shows the introduction of new features and versions is what we call the Roadmap. Currently we are working on new features according to this Roadmap, minor updates, bug fixes, etc.
Servers
The online availability of the Tygron Engine is split up between three different server environments, each with their own dedicated purpose.
engine.tygron.com (Long Term Support)
Updated once per year, the Long Term Support server (LTS) at engine.tygron.com is the most stable version of the Tygron Engine, and is specifically for long term projects that need a stable environment.
preview.tygron.com
Main article: Preview Server
The preview server (preview.tygron.com) is updated more often, 4 times per year, and will contain more recent new features. Because these new features are not fully tested and optimized yet, and are prone to change based on end user feedback, the preview server is not well suited for long term projects. The release cycle on this preview server consists of 2 months of roadmap development and 1 month of user feedback fixes and additional bug fixes.
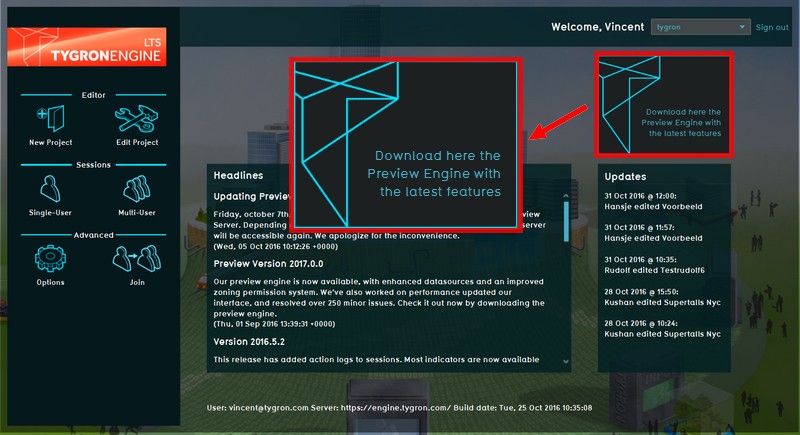
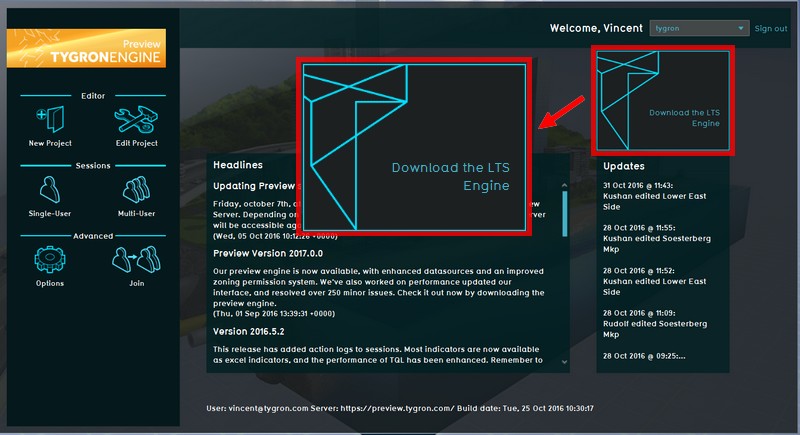
All registered users have access to both the LTS and the preview servers. The main menu offers an option to switch to the other server by downloading the appropriate client.
test.tygron.com
The third server is our dedicated development and test environment. New features are first published in this environment, and tested internally for functionality, compatibility and stability. End users do not automatically have access to this development and test environment.
Server release cycle
The Tygron Engine development process is defined by developing, testing and releasing quarterly preview versions, resulting in a yearly cumulative final release on the LTS (Long Term Support) server. Sometimes circumstances lead to extra updates or hot fixes outside the Roadmap, often due to hardware, driver or Operating System updates.
What to expect?
Current development on test server
- New 2D GIS Webbrowser Viewer.
- Generating 30x30KM Maps with Hi-End hardware.
- Interface improvements including new pop-up icons.
- More feedback for Excel calculations: e.g. a file wich shows calculation times of specific tables.
Recent previous versions
Further development for 2017
The following developments are still in the planning stage:
- Continuing development on the HEAT network system.
- More R&D into GPU accelerated calculations.
- New Selection and Overlay system. The current system is too heavy and is restricting further development. We are moving to an GPU accelerated system.
- Start menu overhaul and new domain management and project selection info.
- Improvement of loading GEO data and more flexibility for Clients to customize the data.
- Improving the UI based on user feedback.
- Generic Grid Overlays. User can make custom overlays based on his own formulas.
Version numbers
A brief explanation about the meaning of the version numbers.
Version numbers consist of 4 digits: For example: 2017.1.4.2
- 2017: The main number represents the year of LTS release.
- 1: This represents the preview release, in this case the first quarter of the year.
- 4: Represents a small update for a feature/bug where the API has been changed.
- 2: Represents an even smaller update or hotfix where the API explicitly does NOT change

